| Red | Green | Blue | |
| z | 17.64 | ||
| znorm | Inf | ||
| sky | -Inf | -Inf | -NaN |
| S/N | 25.5 | 43.9 | 50.8 |
| S/N(c) | 0.0 | 0.0 | 0.0 |
| SN(E/C) |
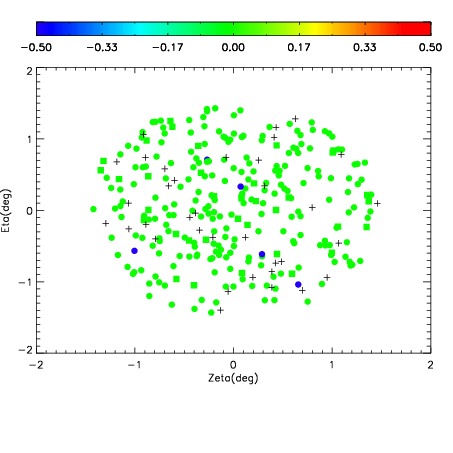
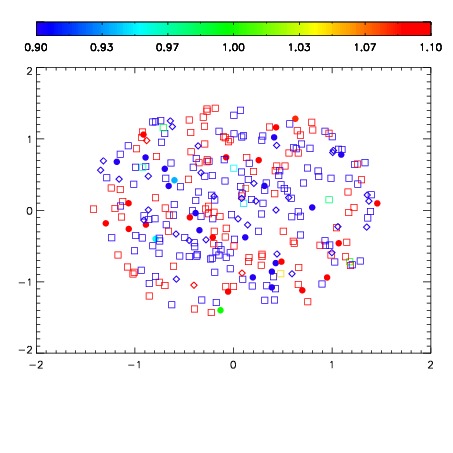
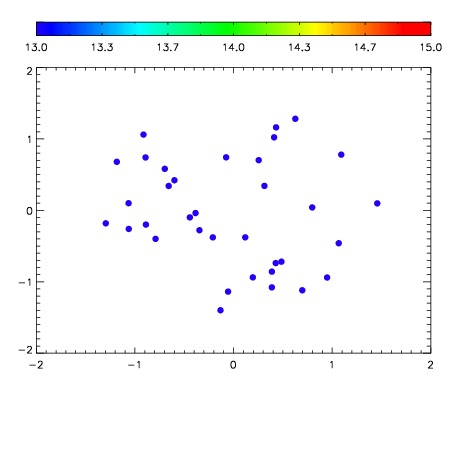

| Frame | Nreads | Zeropoints | Mag plots | Spatial mag deviation | Spatial sky 16325A emission deviations (filled: sky, open: star) | Spatial sky continuum emission | Spatial sky telluric CO2 absorption deviations (filled: H < 10) | |||||||||||||||||||||||
| 0 | 0 |
|
|
|
|
|
|
| IPAIR | NAME | SHIFT | NEWSHIFT | S/N | NAME | SHIFT | NEWSHIFT | S/N |
| 0 | 17320053 | 0.00302082 | 0.00000 | 19.1194 | 17320052 | -0.508012 | 0.511033 | 19.0755 |
| 1 | 17320049 | 0.00257897 | 0.000441850 | 19.0661 | 17320051 | -0.508180 | 0.511201 | 19.0330 |
| 2 | 17320050 | 0.00295642 | 6.44000e-05 | 19.0451 | 17320048 | -0.508404 | 0.511425 | 19.0280 |
| 3 | 17320046 | 0.00000 | 0.00302082 | 18.9479 | 17320047 | -0.508764 | 0.511785 | 18.9971 |