| Red | Green | Blue | |
| z | 17.64 | ||
| znorm | Inf | ||
| sky | -Inf | -Inf | -Inf |
| S/N | 7.7 | 12.7 | 15.1 |
| S/N(c) | 0.0 | 0.0 | 0.0 |
| SN(E/C) |
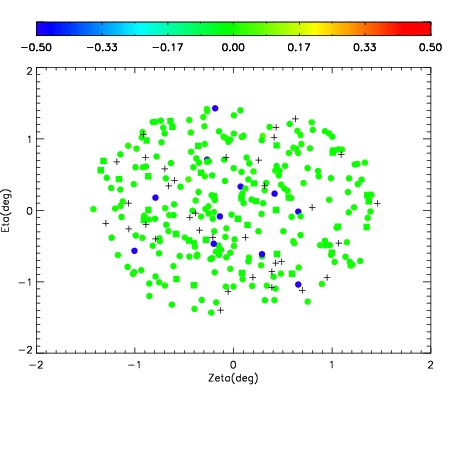
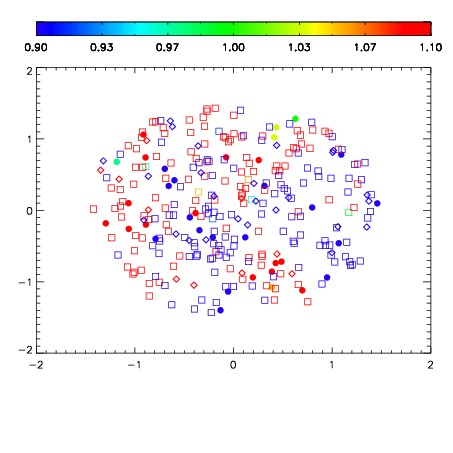
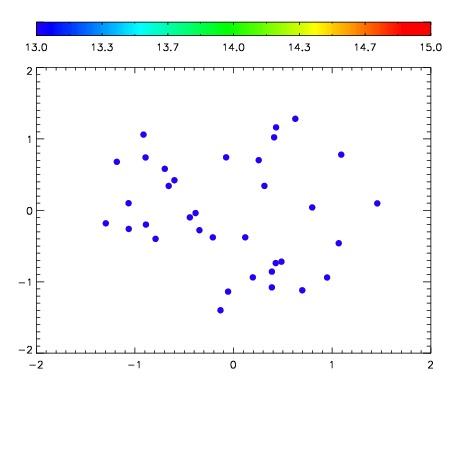

| Frame | Nreads | Zeropoints | Mag plots | Spatial mag deviation | Spatial sky 16325A emission deviations (filled: sky, open: star) | Spatial sky continuum emission | Spatial sky telluric CO2 absorption deviations (filled: H < 10) | |||||||||||||||||||||||
| 0 | 0 |
|
|
|
|
|
|
| IPAIR | NAME | SHIFT | NEWSHIFT | S/N | NAME | SHIFT | NEWSHIFT | S/N |
| 0 | 17590039 | 0.508449 | 0.00000 | 16.0169 | 17590040 | 0.00386042 | 0.504589 | 15.6647 |
| 1 | 17590034 | 0.506749 | 0.00170004 | 18.3726 | 17590033 | 0.00000 | 0.508449 | 18.3611 |
| 2 | 17590035 | 0.507568 | 0.000881016 | 17.8078 | 17590036 | 0.00237642 | 0.506073 | 18.0446 |
| 3 | 17590038 | 0.507837 | 0.000612020 | 17.1404 | 17590037 | 0.00220398 | 0.506245 | 17.6787 |