| Red | Green | Blue | |
| z | 17.64 | ||
| znorm | Inf | ||
| sky | -Inf | -Inf | -NaN |
| S/N | 16.1 | 28.7 | 33.3 |
| S/N(c) | 0.0 | 0.0 | 0.0 |
| SN(E/C) |
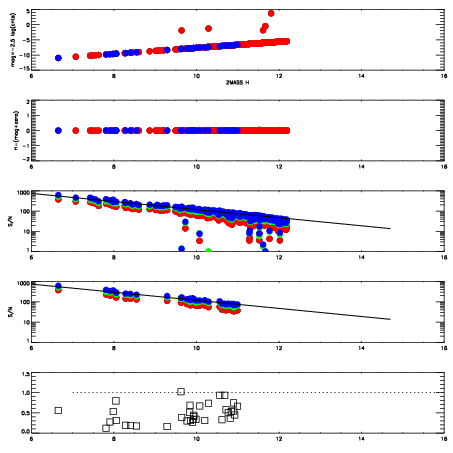
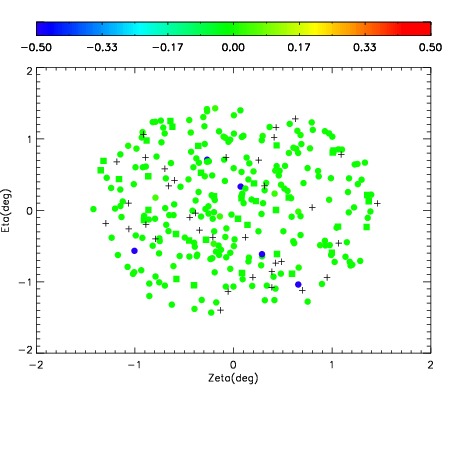
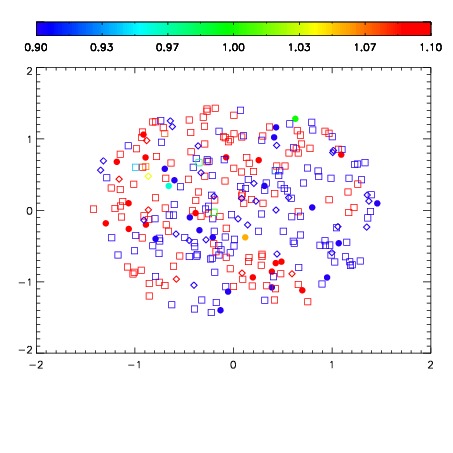


| Frame | Nreads | Zeropoints | Mag plots | Spatial mag deviation | Spatial sky 16325A emission deviations (filled: sky, open: star) | Spatial sky continuum emission | Spatial sky telluric CO2 absorption deviations (filled: H < 10) | |||||||||||||||||||||||
| 0 | 0 |
|
|
|
|
|
|
| IPAIR | NAME | SHIFT | NEWSHIFT | S/N | NAME | SHIFT | NEWSHIFT | S/N |
| 0 | 17610048 | 0.515949 | 0.00000 | 18.5889 | 17610046 | 0.00240655 | 0.513542 | 18.6809 |
| 1 | 17610047 | 0.515182 | 0.000766993 | 18.5091 | 17610045 | 0.00217500 | 0.513774 | 18.6801 |
| 2 | 17610043 | 0.513426 | 0.00252301 | 18.3421 | 17610049 | 0.00463467 | 0.511314 | 18.6012 |
| 3 | 17610044 | 0.513645 | 0.00230402 | 17.8515 | 17610042 | 0.00000 | 0.515949 | 17.8429 |