| Red | Green | Blue | |
| z | 17.64 | ||
| znorm | Inf | ||
| sky | -Inf | -Inf | -Inf |
| S/N | 26.2 | 46.5 | 55.5 |
| S/N(c) | 0.0 | 0.0 | 0.0 |
| SN(E/C) |


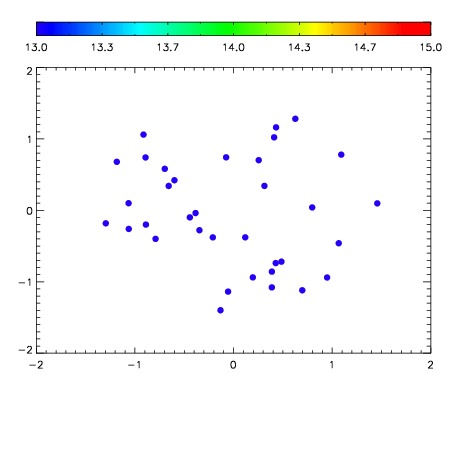

| Frame | Nreads | Zeropoints | Mag plots | Spatial mag deviation | Spatial sky 16325A emission deviations (filled: sky, open: star) | Spatial sky continuum emission | Spatial sky telluric CO2 absorption deviations (filled: H < 10) | |||||||||||||||||||||||
| 0 | 0 |
|
|
|
|
|
|
| IPAIR | NAME | SHIFT | NEWSHIFT | S/N | NAME | SHIFT | NEWSHIFT | S/N |
| 0 | 17850031 | 0.00329019 | 0.00000 | 18.9955 | 17850033 | -0.513959 | 0.517249 | 19.0014 |
| 1 | 17850032 | 0.00288782 | 0.000402370 | 19.0003 | 17850030 | -0.511996 | 0.515286 | 19.0307 |
| 2 | 17850028 | 0.00167583 | 0.00161436 | 18.9022 | 17850029 | -0.512474 | 0.515764 | 18.9244 |
| 3 | 17850024 | 0.00000 | 0.00329019 | 18.8793 | 17850025 | -0.514210 | 0.517500 | 18.8877 |
| 4 | 17850027 | 0.00114219 | 0.00214800 | 18.8002 | 17850026 | -0.514114 | 0.517404 | 18.8419 |