| Red | Green | Blue | |
| z | 17.64 | ||
| znorm | Inf | ||
| sky | -Inf | -Inf | -NaN |
| S/N | 23.6 | 42.0 | 45.4 |
| S/N(c) | 0.0 | 0.0 | 0.0 |
| SN(E/C) |
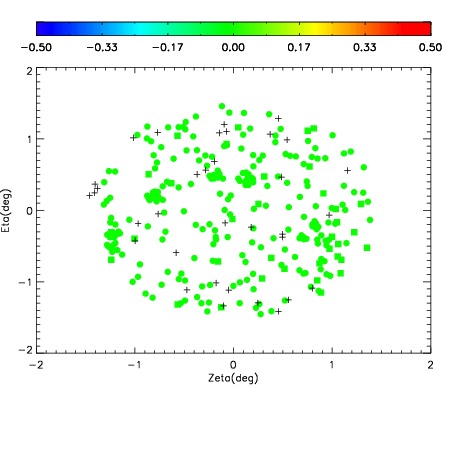
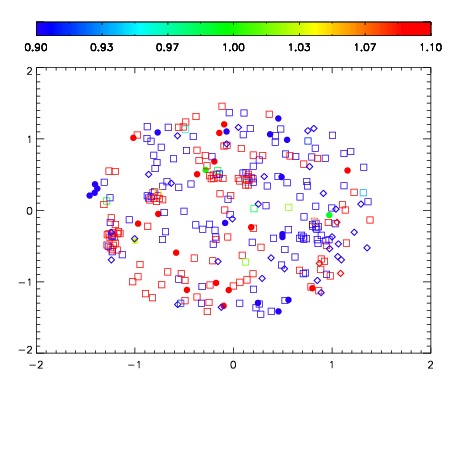
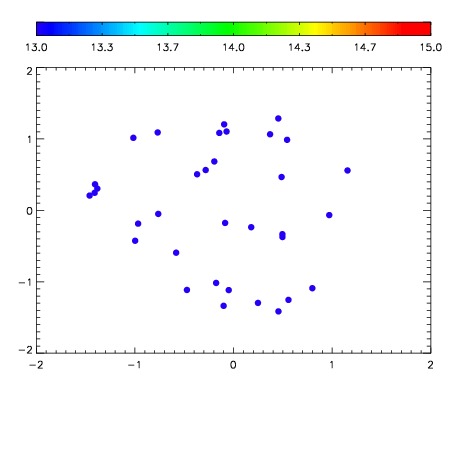

| Frame | Nreads | Zeropoints | Mag plots | Spatial mag deviation | Spatial sky 16325A emission deviations (filled: sky, open: star) | Spatial sky continuum emission | Spatial sky telluric CO2 absorption deviations (filled: H < 10) | |||||||||||||||||||||||
| 0 | 0 |
|
|
|
|
|
|
| IPAIR | NAME | SHIFT | NEWSHIFT | S/N | NAME | SHIFT | NEWSHIFT | S/N |
| 0 | 13410043 | 0.509014 | 0.00000 | 19.0008 | 13410041 | 0.000837662 | 0.508176 | 18.9971 |
| 1 | 13410042 | 0.508313 | 0.000701010 | 19.0480 | 13410037 | 0.00000 | 0.509014 | 19.1047 |
| 2 | 13410039 | 0.508481 | 0.000532985 | 18.9743 | 13410040 | 0.00106104 | 0.507953 | 18.9124 |
| 3 | 13410038 | 0.508134 | 0.000880003 | 18.9723 | 13410044 | 0.000870439 | 0.508144 | 18.8922 |