| Red | Green | Blue | |
| z | 17.63 | ||
| znorm | Inf | ||
| sky | -NaN | -NaN | -NaN |
| S/N | 25.7 | 45.3 | 48.0 |
| S/N(c) | 0.0 | 0.0 | 0.0 |
| SN(E/C) |
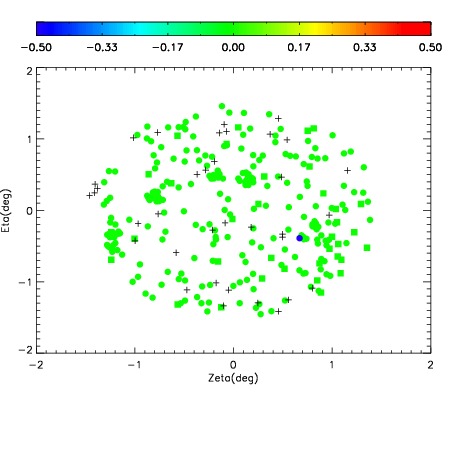
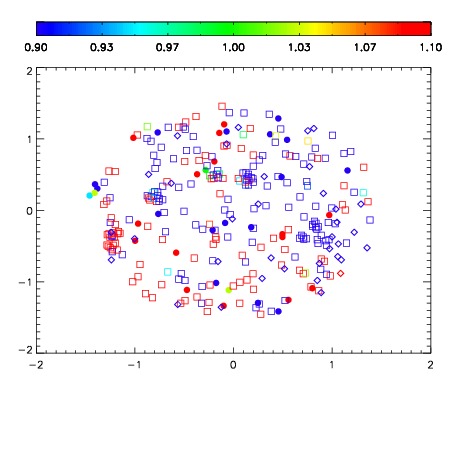
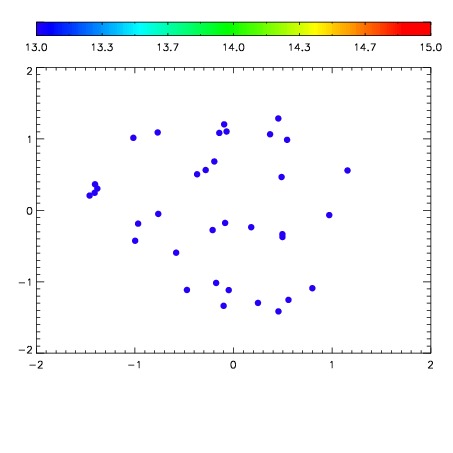

| Frame | Nreads | Zeropoints | Mag plots | Spatial mag deviation | Spatial sky 16325A emission deviations (filled: sky, open: star) | Spatial sky continuum emission | Spatial sky telluric CO2 absorption deviations (filled: H < 10) | |||||||||||||||||||||||
| 0 | 0 |
|
|
|
|
|
|
| IPAIR | NAME | SHIFT | NEWSHIFT | S/N | NAME | SHIFT | NEWSHIFT | S/N |
| 0 | 13700032 | 0.505496 | 0.00000 | 19.0507 | 13700029 | 0.000245537 | 0.505251 | 19.0711 |
| 1 | 13700027 | 0.503683 | 0.00181305 | 19.0662 | 13700033 | 0.000568459 | 0.504928 | 19.0712 |
| 2 | 13700028 | 0.504076 | 0.00142002 | 19.0362 | 13700030 | -0.000339518 | 0.505836 | 19.0566 |
| 3 | 13700031 | 0.505158 | 0.000338018 | 19.0332 | 13700026 | 0.00000 | 0.505496 | 19.0514 |