| Red | Green | Blue | |
| z | 17.64 | ||
| znorm | Inf | ||
| sky | -Inf | -Inf | -NaN |
| S/N | 24.4 | 40.7 | 45.6 |
| S/N(c) | 0.0 | 0.0 | 0.0 |
| SN(E/C) |
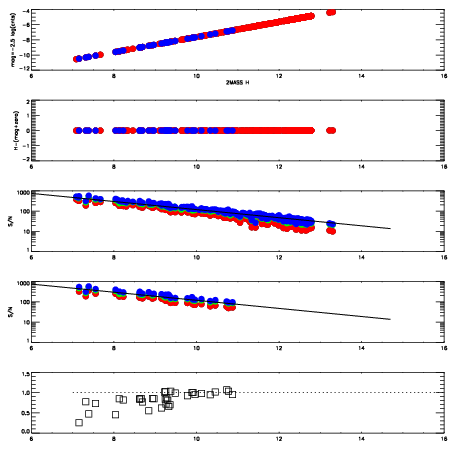
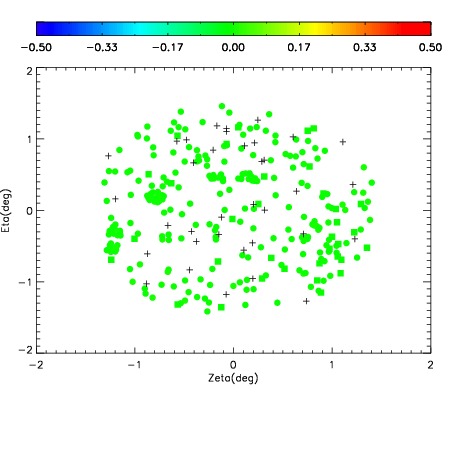
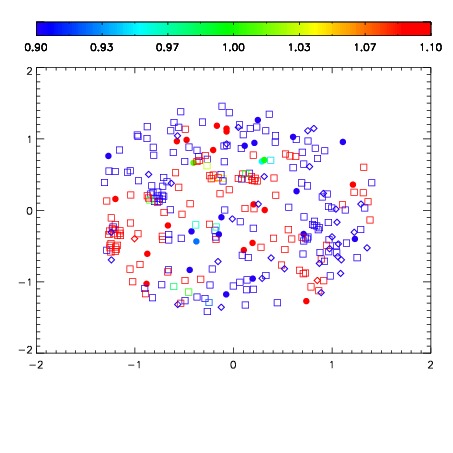
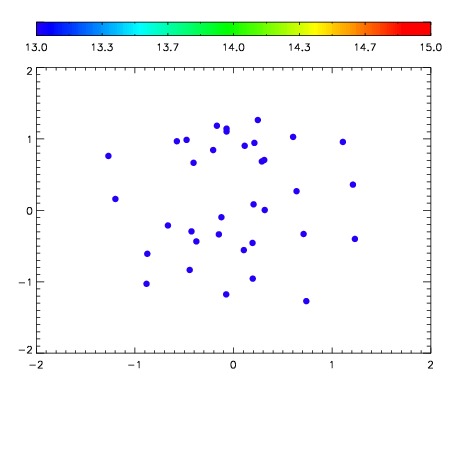

| Frame | Nreads | Zeropoints | Mag plots | Spatial mag deviation | Spatial sky 16325A emission deviations (filled: sky, open: star) | Spatial sky continuum emission | Spatial sky telluric CO2 absorption deviations (filled: H < 10) | |||||||||||||||||||||||
| 0 | 0 |
|
|
|
|
|
|
| IPAIR | NAME | SHIFT | NEWSHIFT | S/N | NAME | SHIFT | NEWSHIFT | S/N |
| 0 | 13420038 | 0.504437 | 0.00000 | 18.8924 | 13420043 | -0.00167040 | 0.506107 | 18.8814 |
| 1 | 13420042 | 0.503847 | 0.000590026 | 18.9467 | 13420039 | -0.00167605 | 0.506113 | 18.9303 |
| 2 | 13420037 | 0.504411 | 2.60472e-05 | 18.8982 | 13420040 | -0.00188890 | 0.506326 | 18.8894 |
| 3 | 13420041 | 0.504075 | 0.000362039 | 18.7826 | 13420036 | 0.00000 | 0.504437 | 18.8303 |