| Red | Green | Blue | |
| z | 17.64 | ||
| znorm | Inf | ||
| sky | -Inf | -Inf | -NaN |
| S/N | 18.0 | 30.8 | 34.9 |
| S/N(c) | 0.0 | 0.0 | 0.0 |
| SN(E/C) |
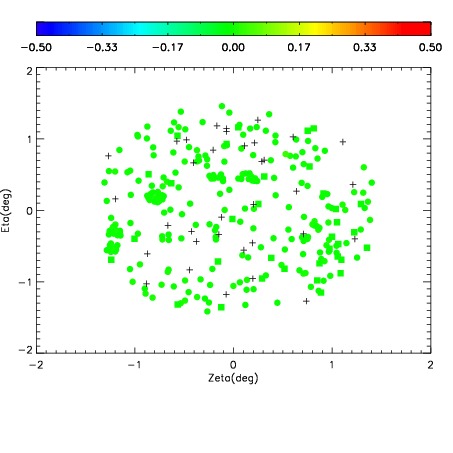
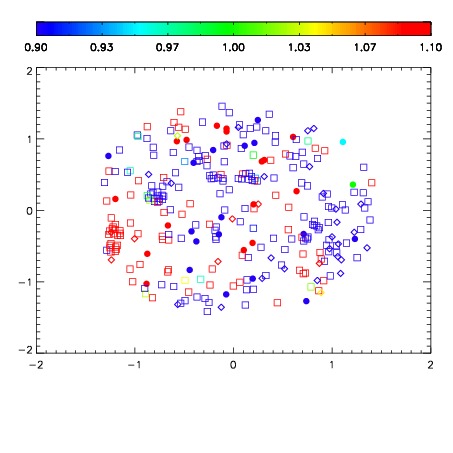


| Frame | Nreads | Zeropoints | Mag plots | Spatial mag deviation | Spatial sky 16325A emission deviations (filled: sky, open: star) | Spatial sky continuum emission | Spatial sky telluric CO2 absorption deviations (filled: H < 10) | |||||||||||||||||||||||
| 0 | 0 |
|
|
|
|
|
|
| IPAIR | NAME | SHIFT | NEWSHIFT | S/N | NAME | SHIFT | NEWSHIFT | S/N |
| 0 | 14000017 | 0.499594 | 0.00000 | 16.9852 | 14000018 | 0.000825613 | 0.498768 | 17.3913 |
| 1 | 14000013 | 0.499531 | 6.30021e-05 | 18.8751 | 14000014 | 0.000339187 | 0.499255 | 18.7863 |
| 2 | 14000012 | 0.498902 | 0.000692010 | 18.8632 | 14000011 | 0.00000 | 0.499594 | 18.7583 |
| 3 | 14000016 | 0.499030 | 0.000564009 | 18.3481 | 14000015 | 0.000366919 | 0.499227 | 18.3446 |