| Red | Green | Blue | |
| z | 17.64 | ||
| znorm | Inf | ||
| sky | -Inf | -Inf | -Inf |
| S/N | 28.4 | 46.7 | 52.6 |
| S/N(c) | 0.0 | 0.0 | 0.0 |
| SN(E/C) |

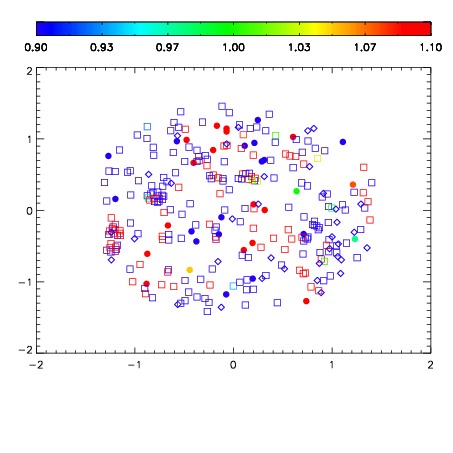


| Frame | Nreads | Zeropoints | Mag plots | Spatial mag deviation | Spatial sky 16325A emission deviations (filled: sky, open: star) | Spatial sky continuum emission | Spatial sky telluric CO2 absorption deviations (filled: H < 10) | |||||||||||||||||||||||
| 0 | 0 |
|
|
|
|
|
|
| IPAIR | NAME | SHIFT | NEWSHIFT | S/N | NAME | SHIFT | NEWSHIFT | S/N |
| 0 | 16120024 | 0.495894 | 0.00000 | 19.1078 | 16120029 | 0.000624538 | 0.495269 | 19.0999 |
| 1 | 16120028 | 0.495749 | 0.000145018 | 19.1274 | 16120022 | 0.00000 | 0.495894 | 19.1118 |
| 2 | 16120027 | 0.495690 | 0.000204027 | 19.0953 | 16120026 | 0.000225264 | 0.495669 | 19.0884 |
| 3 | 16120023 | 0.495768 | 0.000126004 | 19.0855 | 16120025 | 0.000318788 | 0.495575 | 19.0488 |