| Red | Green | Blue | |
| z | 17.64 | ||
| znorm | Inf | ||
| sky | -Inf | -Inf | -Inf |
| S/N | 30.8 | 51.8 | 56.8 |
| S/N(c) | 0.0 | 0.0 | 0.0 |
| SN(E/C) |
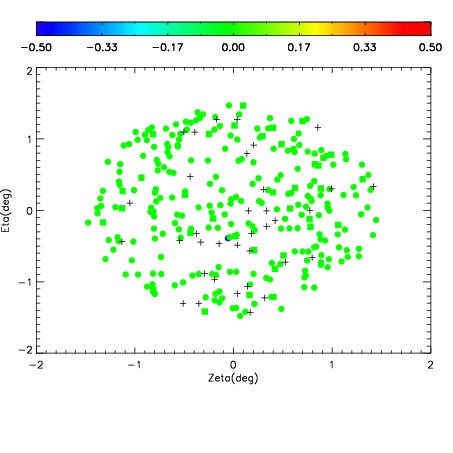
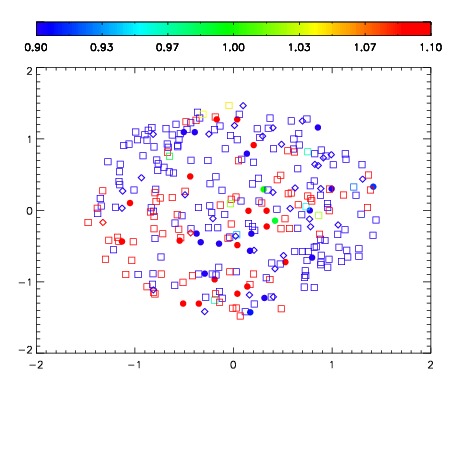
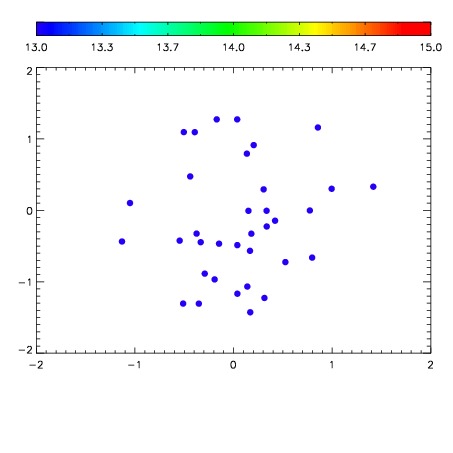

| Frame | Nreads | Zeropoints | Mag plots | Spatial mag deviation | Spatial sky 16325A emission deviations (filled: sky, open: star) | Spatial sky continuum emission | Spatial sky telluric CO2 absorption deviations (filled: H < 10) | |||||||||||||||||||||||
| 0 | 0 |
|
|
|
|
|
|
| IPAIR | NAME | SHIFT | NEWSHIFT | S/N | NAME | SHIFT | NEWSHIFT | S/N |
| 0 | 13710027 | 0.500719 | 0.00000 | 19.1816 | 13710032 | -0.00328918 | 0.504008 | 19.1934 |
| 1 | 13710030 | 0.497930 | 0.00278902 | 19.1953 | 13710029 | -0.00228125 | 0.503000 | 19.2116 |
| 2 | 13710031 | 0.497832 | 0.00288701 | 19.1818 | 13710028 | -0.00165967 | 0.502379 | 19.1978 |
| 3 | 13710026 | 0.500353 | 0.000366032 | 19.1725 | 13710025 | 0.00000 | 0.500719 | 19.1514 |