| Red | Green | Blue | |
| z | 17.64 | ||
| znorm | Inf | ||
| sky | -Inf | -Inf | -Inf |
| S/N | 16.2 | 30.6 | 32.5 |
| S/N(c) | 0.0 | 0.0 | 0.0 |
| SN(E/C) |
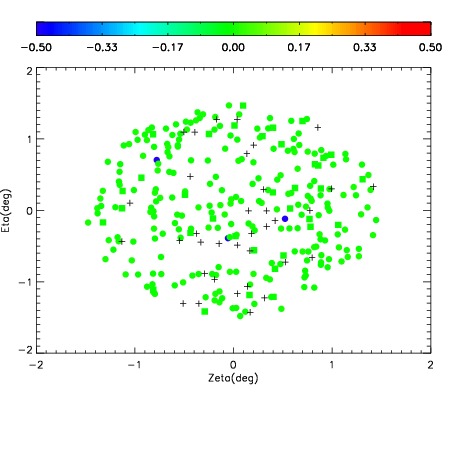
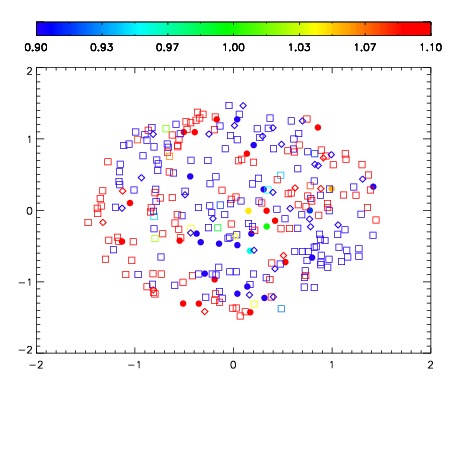
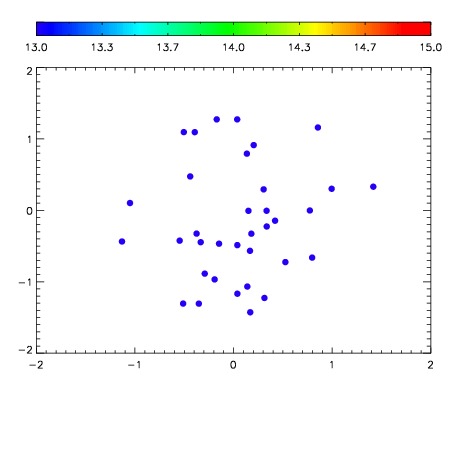

| Frame | Nreads | Zeropoints | Mag plots | Spatial mag deviation | Spatial sky 16325A emission deviations (filled: sky, open: star) | Spatial sky continuum emission | Spatial sky telluric CO2 absorption deviations (filled: H < 10) | |||||||||||||||||||||||
| 0 | 0 |
|
|
|
|
|
|
| IPAIR | NAME | SHIFT | NEWSHIFT | S/N | NAME | SHIFT | NEWSHIFT | S/N |
| 0 | 13990028 | 0.500334 | 0.00000 | 18.0695 | 13990026 | 0.00105471 | 0.499279 | 18.1797 |
| 1 | 13990024 | 0.499055 | 0.00127903 | 18.4570 | 13990022 | 0.00000 | 0.500334 | 18.3894 |
| 2 | 13990023 | 0.498424 | 0.00191003 | 18.3233 | 13990025 | 0.000700116 | 0.499634 | 18.3678 |
| 3 | 13990027 | 0.500225 | 0.000109017 | 17.9641 | 13990029 | 0.00187298 | 0.498461 | 18.0500 |