| Red | Green | Blue | |
| z | 17.64 | ||
| znorm | Inf | ||
| sky | -Inf | -NaN | -NaN |
| S/N | 22.1 | 34.7 | 39.1 |
| S/N(c) | 0.0 | 0.0 | 0.0 |
| SN(E/C) |
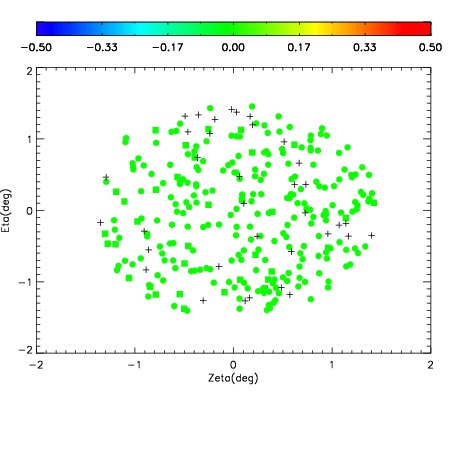
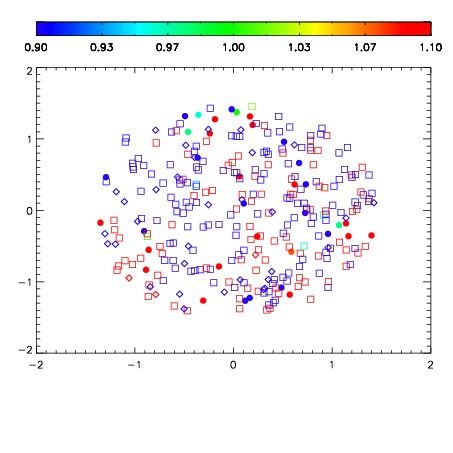
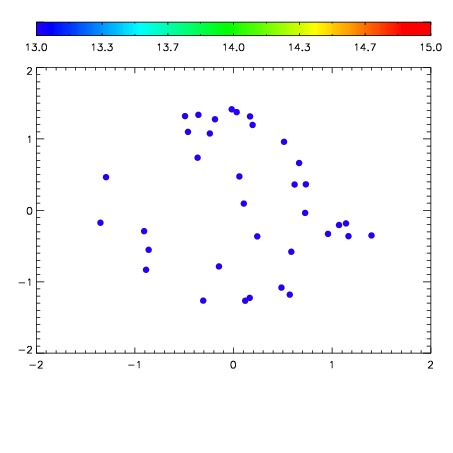

| Frame | Nreads | Zeropoints | Mag plots | Spatial mag deviation | Spatial sky 16325A emission deviations (filled: sky, open: star) | Spatial sky continuum emission | Spatial sky telluric CO2 absorption deviations (filled: H < 10) | |||||||||||||||||||||||
| 0 | 0 |
|
|
|
|
|
|
| IPAIR | NAME | SHIFT | NEWSHIFT | S/N | NAME | SHIFT | NEWSHIFT | S/N |
| 0 | 13400042 | 0.506687 | 0.00000 | 19.2279 | 13400043 | -0.00142591 | 0.508113 | 19.2196 |
| 1 | 13400041 | 0.506559 | 0.000127971 | 19.2084 | 13400040 | 0.00000 | 0.506687 | 19.2189 |