| Red | Green | Blue | |
| z | 17.64 | ||
| znorm | Inf | ||
| sky | -Inf | -Inf | -NaN |
| S/N | 28.8 | 47.9 | 54.5 |
| S/N(c) | 0.0 | 0.0 | 0.0 |
| SN(E/C) |
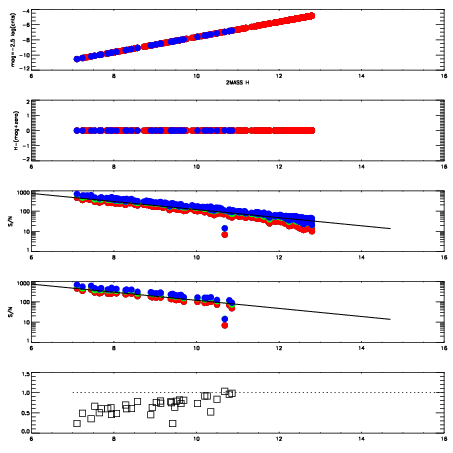

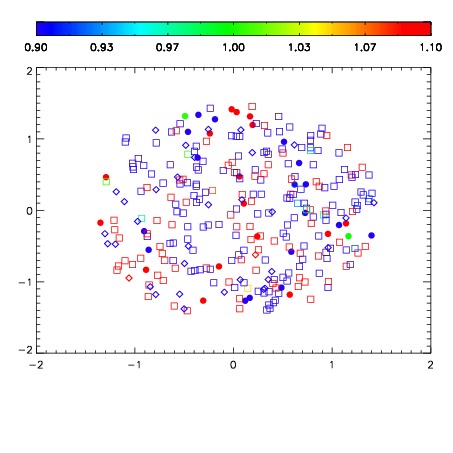
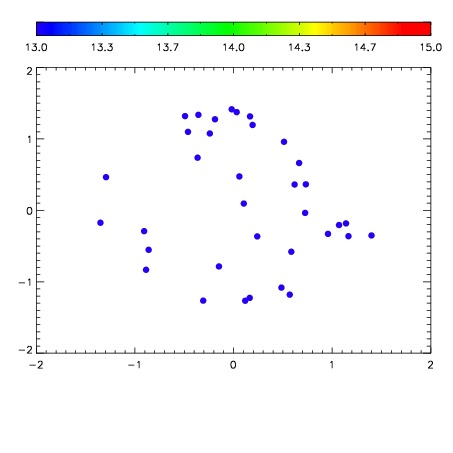

| Frame | Nreads | Zeropoints | Mag plots | Spatial mag deviation | Spatial sky 16325A emission deviations (filled: sky, open: star) | Spatial sky continuum emission | Spatial sky telluric CO2 absorption deviations (filled: H < 10) | |||||||||||||||||||||||
| 0 | 0 |
|
|
|
|
|
|
| IPAIR | NAME | SHIFT | NEWSHIFT | S/N | NAME | SHIFT | NEWSHIFT | S/N |
| 0 | 13480034 | 0.503795 | 0.00000 | 19.2215 | 13480031 | 0.000439879 | 0.503355 | 19.2130 |
| 1 | 13480033 | 0.503116 | 0.000679016 | 19.2320 | 13480032 | 0.000826384 | 0.502969 | 19.2341 |
| 2 | 13480029 | 0.502637 | 0.00115800 | 19.1997 | 13480035 | 0.000451934 | 0.503343 | 19.2090 |
| 3 | 13480030 | 0.503136 | 0.000659049 | 19.1822 | 13480028 | 0.00000 | 0.503795 | 19.1839 |