| Red | Green | Blue | |
| z | 17.64 | ||
| znorm | Inf | ||
| sky | -Inf | -Inf | -Inf |
| S/N | 26.5 | 45.6 | 51.2 |
| S/N(c) | 0.0 | 0.0 | 0.0 |
| SN(E/C) |
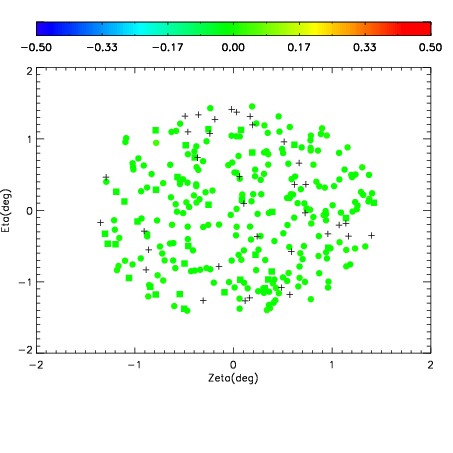
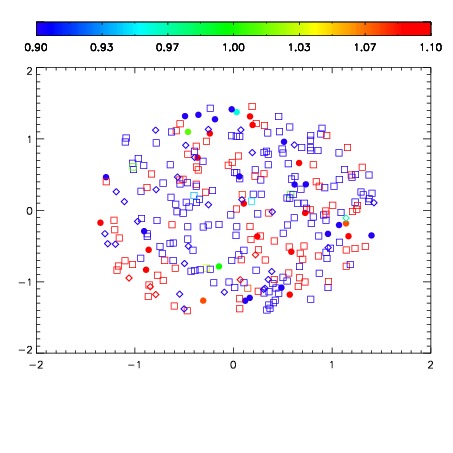
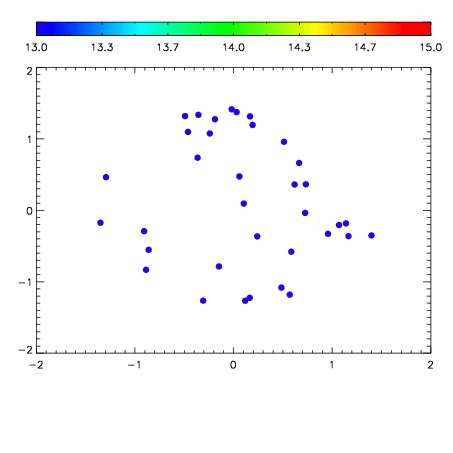

| Frame | Nreads | Zeropoints | Mag plots | Spatial mag deviation | Spatial sky 16325A emission deviations (filled: sky, open: star) | Spatial sky continuum emission | Spatial sky telluric CO2 absorption deviations (filled: H < 10) | |||||||||||||||||||||||
| 0 | 0 |
|
|
|
|
|
|
| IPAIR | NAME | SHIFT | NEWSHIFT | S/N | NAME | SHIFT | NEWSHIFT | S/N |
| 0 | 13690032 | 0.504950 | 0.00000 | 19.1023 | 13690033 | 0.00127450 | 0.503675 | 19.0886 |
| 1 | 13690028 | 0.504789 | 0.000160992 | 19.1642 | 13690029 | -0.000978067 | 0.505928 | 19.1659 |
| 2 | 13690027 | 0.504415 | 0.000535011 | 19.1536 | 13690026 | 0.00000 | 0.504950 | 19.1531 |
| 3 | 13690031 | 0.503626 | 0.00132400 | 19.1486 | 13690030 | -0.000708238 | 0.505658 | 19.1346 |