| Red | Green | Blue | |
| z | 17.64 | ||
| znorm | Inf | ||
| sky | -Inf | -Inf | -NaN |
| S/N | 22.2 | 38.9 | 44.4 |
| S/N(c) | 0.0 | 0.0 | 0.0 |
| SN(E/C) |


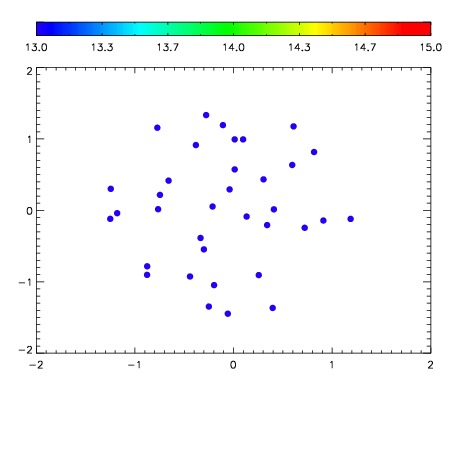

| Frame | Nreads | Zeropoints | Mag plots | Spatial mag deviation | Spatial sky 16325A emission deviations (filled: sky, open: star) | Spatial sky continuum emission | Spatial sky telluric CO2 absorption deviations (filled: H < 10) | |||||||||||||||||||||||
| 0 | 0 |
|
|
|
|
|
|
| IPAIR | NAME | SHIFT | NEWSHIFT | S/N | NAME | SHIFT | NEWSHIFT | S/N |
| 0 | 14350022 | 0.501366 | 0.00000 | 18.3610 | 14350016 | 0.00000 | 0.501366 | 18.5686 |
| 1 | 14350021 | 0.500392 | 0.000974000 | 18.7777 | 14350020 | 0.00109426 | 0.500272 | 18.7335 |
| 2 | 14350017 | 0.499945 | 0.00142100 | 18.7132 | 14350019 | 0.000859711 | 0.500506 | 18.6990 |
| 3 | 14350018 | 0.500644 | 0.000721991 | 18.6226 | 14350023 | 0.00135964 | 0.500006 | 18.5695 |
| 4 | 14350025 | 0.500614 | 0.000752032 | 17.9386 | 14350024 | 0.00152235 | 0.499844 | 18.5600 |