| Red | Green | Blue | |
| z | 17.64 | ||
| znorm | Inf | ||
| sky | -Inf | -Inf | -NaN |
| S/N | 13.5 | 26.1 | 28.1 |
| S/N(c) | 0.0 | 0.0 | 0.0 |
| SN(E/C) |
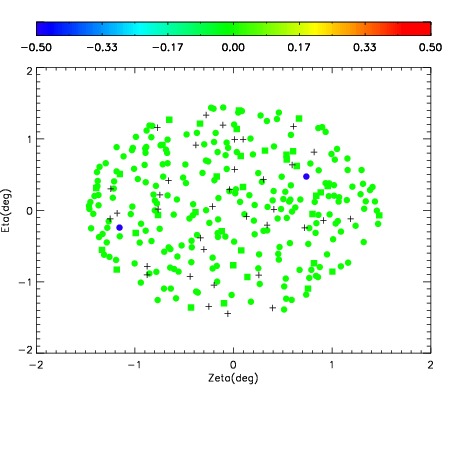
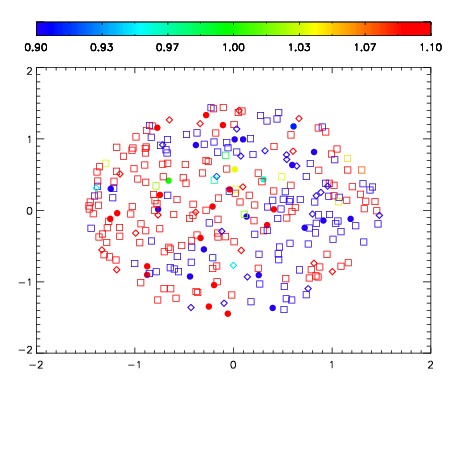
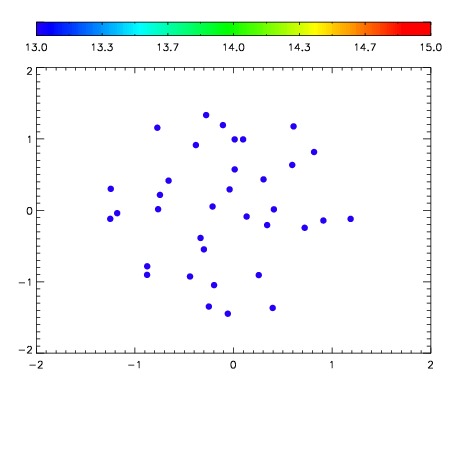

| Frame | Nreads | Zeropoints | Mag plots | Spatial mag deviation | Spatial sky 16325A emission deviations (filled: sky, open: star) | Spatial sky continuum emission | Spatial sky telluric CO2 absorption deviations (filled: H < 10) | |||||||||||||||||||||||
| 0 | 0 |
|
|
|
|
|
|
| IPAIR | NAME | SHIFT | NEWSHIFT | S/N | NAME | SHIFT | NEWSHIFT | S/N |
| 0 | 14380023 | 0.498232 | 0.00000 | 17.6762 | 14380024 | 0.00129883 | 0.496933 | 17.8493 |
| 1 | 14380019 | 0.497860 | 0.000371993 | 18.2846 | 14380020 | 0.00155237 | 0.496680 | 18.3831 |
| 2 | 14380022 | 0.497466 | 0.000766009 | 18.1722 | 14380021 | 0.00170341 | 0.496529 | 18.2529 |
| 3 | 14380018 | 0.497081 | 0.00115100 | 17.9537 | 14380017 | 0.00000 | 0.498232 | 17.9323 |