| Red | Green | Blue | |
| z | 17.64 | ||
| znorm | Inf | ||
| sky | -Inf | -NaN | -NaN |
| S/N | 23.4 | 37.6 | 41.3 |
| S/N(c) | 0.0 | 0.0 | 0.0 |
| SN(E/C) |
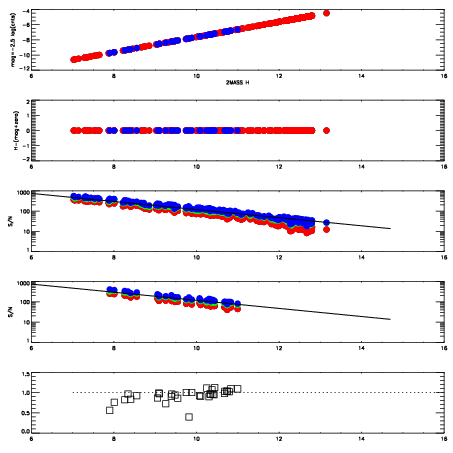
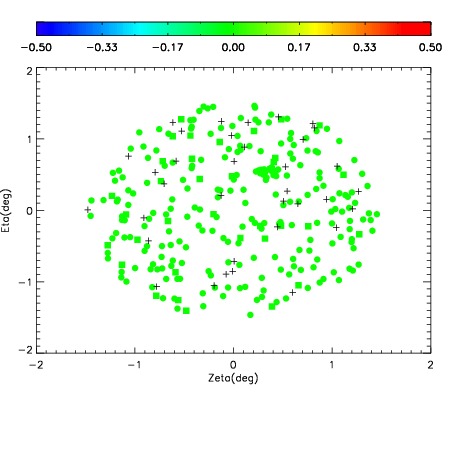
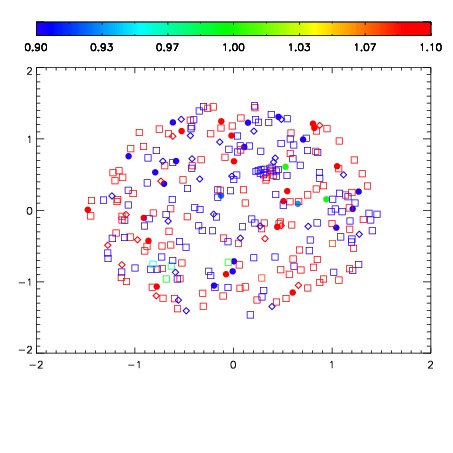


| Frame | Nreads | Zeropoints | Mag plots | Spatial mag deviation | Spatial sky 16325A emission deviations (filled: sky, open: star) | Spatial sky continuum emission | Spatial sky telluric CO2 absorption deviations (filled: H < 10) | |||||||||||||||||||||||
| 0 | 0 |
|
|
|
|
|
|
| IPAIR | NAME | SHIFT | NEWSHIFT | S/N | NAME | SHIFT | NEWSHIFT | S/N |
| 0 | 14100017 | 0.499326 | 0.00000 | 18.8927 | 14100018 | 0.00348118 | 0.495845 | 18.8582 |
| 1 | 14100016 | 0.498999 | 0.000326991 | 18.8652 | 14100014 | -0.000712592 | 0.500039 | 18.8110 |
| 2 | 14100013 | 0.498458 | 0.000867993 | 18.7079 | 14100015 | -0.000932808 | 0.500259 | 18.8056 |
| 3 | 14100012 | 0.498875 | 0.000450999 | 18.6432 | 14100011 | 0.00000 | 0.499326 | 18.6229 |