| Red | Green | Blue | |
| z | 17.64 | ||
| znorm | Inf | ||
| sky | -Inf | -Inf | -Inf |
| S/N | 23.7 | 42.6 | 45.8 |
| S/N(c) | 0.0 | 0.0 | 0.0 |
| SN(E/C) |
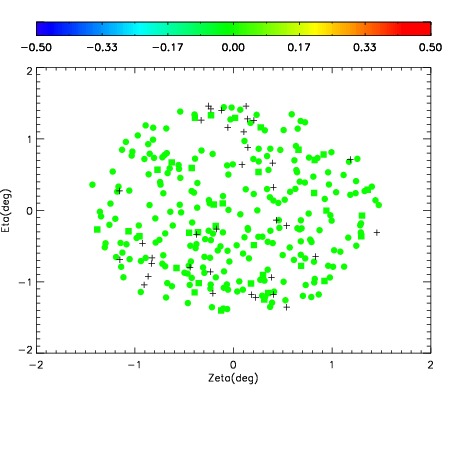
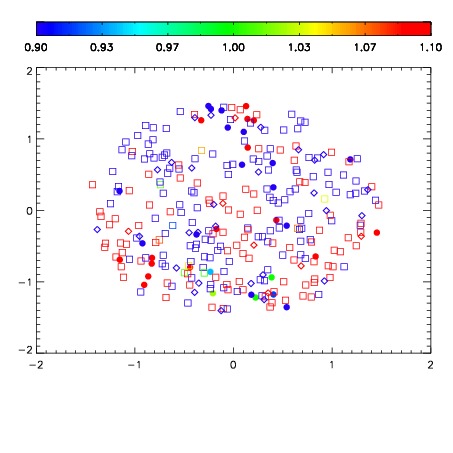
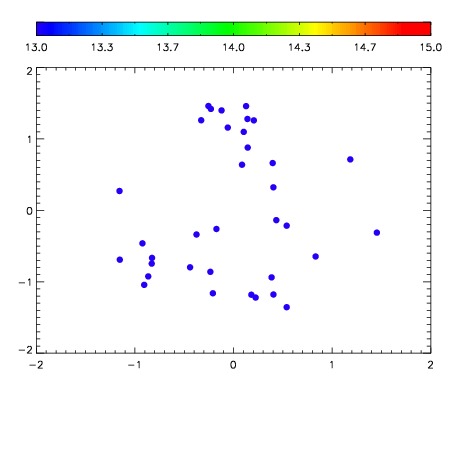

| Frame | Nreads | Zeropoints | Mag plots | Spatial mag deviation | Spatial sky 16325A emission deviations (filled: sky, open: star) | Spatial sky continuum emission | Spatial sky telluric CO2 absorption deviations (filled: H < 10) | |||||||||||||||||||||||
| 0 | 0 |
|
|
|
|
|
|
| IPAIR | NAME | SHIFT | NEWSHIFT | S/N | NAME | SHIFT | NEWSHIFT | S/N |
| 0 | 13420053 | 0.506418 | 0.00000 | 18.9676 | 13420047 | 0.00000 | 0.506418 | 18.9950 |
| 1 | 13420049 | 0.506220 | 0.000198007 | 18.9510 | 13420050 | -0.000395021 | 0.506813 | 18.9556 |
| 2 | 13420048 | 0.505776 | 0.000642002 | 18.9427 | 13420054 | 0.000179013 | 0.506239 | 18.9401 |
| 3 | 13420052 | 0.505862 | 0.000555992 | 18.9066 | 13420051 | 7.53494e-05 | 0.506343 | 18.9123 |