| Red | Green | Blue | |
| z | 17.64 | ||
| znorm | Inf | ||
| sky | -Inf | -NaN | -NaN |
| S/N | 26.4 | 46.9 | 49.1 |
| S/N(c) | 0.0 | 0.0 | 0.0 |
| SN(E/C) |
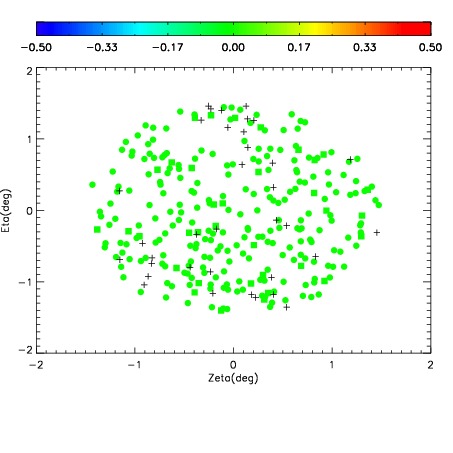
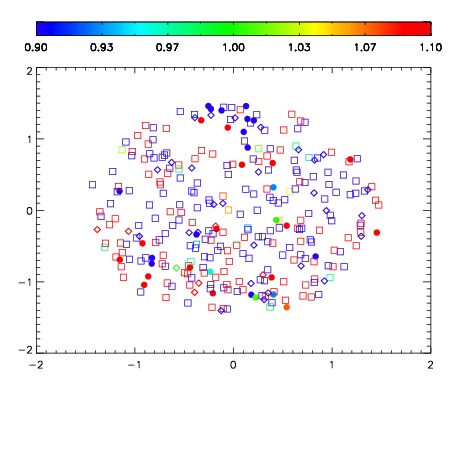


| Frame | Nreads | Zeropoints | Mag plots | Spatial mag deviation | Spatial sky 16325A emission deviations (filled: sky, open: star) | Spatial sky continuum emission | Spatial sky telluric CO2 absorption deviations (filled: H < 10) | |||||||||||||||||||||||
| 0 | 0 |
|
|
|
|
|
|
| IPAIR | NAME | SHIFT | NEWSHIFT | S/N | NAME | SHIFT | NEWSHIFT | S/N |
| 0 | 13480041 | 0.503335 | 0.00000 | 19.1903 | 13480039 | 0.00000 | 0.503335 | 19.1960 |
| 1 | 13480040 | 0.502582 | 0.000752985 | 19.2074 | 13480043 | -8.71485e-05 | 0.503422 | 19.2158 |
| 2 | 13480044 | 0.500750 | 0.00258499 | 19.1921 | 13480042 | 0.000811044 | 0.502524 | 19.2002 |
| 3 | 13480045 | 0.500112 | 0.00322300 | 19.1676 | 13480046 | 0.000172964 | 0.503162 | 19.1508 |