| Red | Green | Blue | |
| z | 17.64 | ||
| znorm | Inf | ||
| sky | -Inf | -Inf | -Inf |
| S/N | 25.3 | 44.2 | 48.1 |
| S/N(c) | 0.0 | 0.0 | 0.0 |
| SN(E/C) |
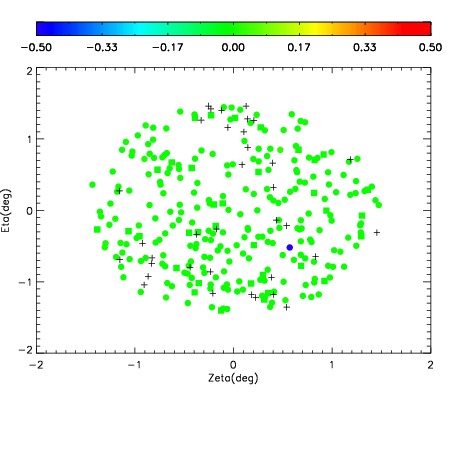
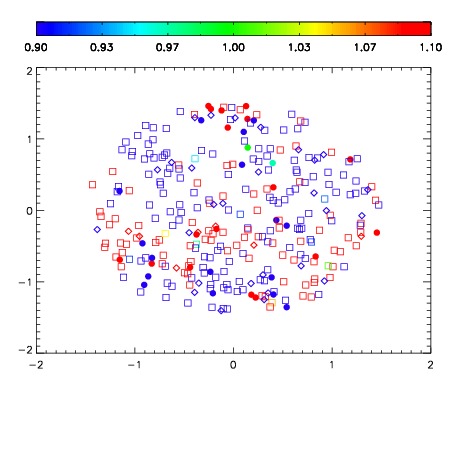


| Frame | Nreads | Zeropoints | Mag plots | Spatial mag deviation | Spatial sky 16325A emission deviations (filled: sky, open: star) | Spatial sky continuum emission | Spatial sky telluric CO2 absorption deviations (filled: H < 10) | |||||||||||||||||||||||
| 0 | 0 |
|
|
|
|
|
|
| IPAIR | NAME | SHIFT | NEWSHIFT | S/N | NAME | SHIFT | NEWSHIFT | S/N |
| 0 | 13720038 | 0.500525 | 0.00000 | 19.2292 | 13720040 | -0.00226229 | 0.502787 | 19.1774 |
| 1 | 13720039 | 0.499924 | 0.000600994 | 19.2347 | 13720037 | 0.00000 | 0.500525 | 19.2009 |
| 2 | 13720043 | 0.496943 | 0.00358200 | 19.1514 | 13720041 | -0.00293177 | 0.503457 | 19.1286 |
| 3 | 13720042 | 0.496653 | 0.00387201 | 19.0834 | 13720044 | -0.00189622 | 0.502421 | 19.1230 |