| Red | Green | Blue | |
| z | 17.64 | ||
| znorm | Inf | ||
| sky | -Inf | -NaN | -Inf |
| S/N | 19.6 | 33.1 | 37.6 |
| S/N(c) | 0.0 | 0.0 | 0.0 |
| SN(E/C) |
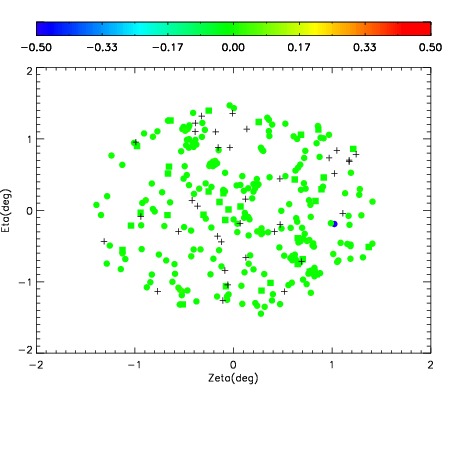
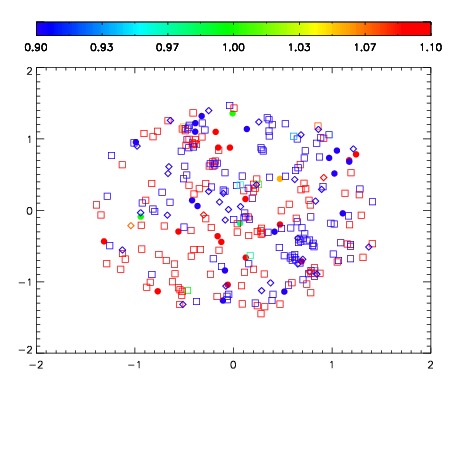
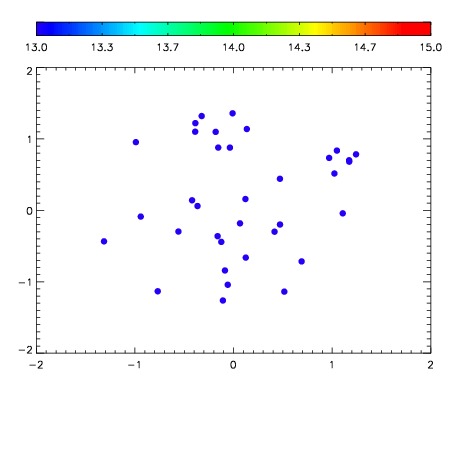

| Frame | Nreads | Zeropoints | Mag plots | Spatial mag deviation | Spatial sky 16325A emission deviations (filled: sky, open: star) | Spatial sky continuum emission | Spatial sky telluric CO2 absorption deviations (filled: H < 10) | |||||||||||||||||||||||
| 0 | 0 |
|
|
|
|
|
|
| IPAIR | NAME | SHIFT | NEWSHIFT | S/N | NAME | SHIFT | NEWSHIFT | S/N |
| 0 | 13760045 | 0.507083 | 0.00000 | 17.6644 | 13760044 | 0.00000 | 0.507083 | 18.1528 |
| 1 | 13760050 | 0.506830 | 0.000253022 | 19.1810 | 13760051 | -0.000534391 | 0.507617 | 19.1050 |
| 2 | 13760049 | 0.505947 | 0.00113600 | 19.1645 | 13760048 | -0.00237419 | 0.509457 | 18.8357 |
| 3 | 13760046 | 0.506889 | 0.000194013 | 17.2192 | 13760047 | -0.00180231 | 0.508885 | 17.9132 |