| Red | Green | Blue | |
| z | 17.64 | ||
| znorm | Inf | ||
| sky | -Inf | -Inf | -NaN |
| S/N | 29.3 | 47.7 | 55.2 |
| S/N(c) | 0.0 | 0.0 | 0.0 |
| SN(E/C) |
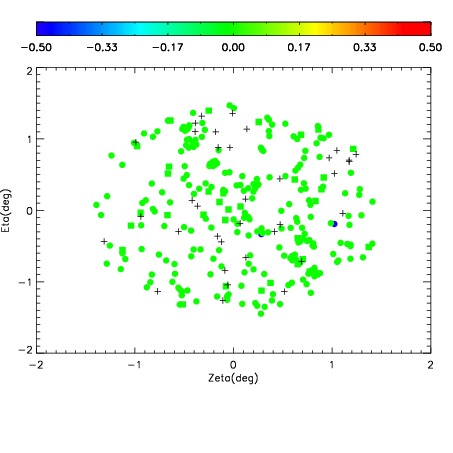
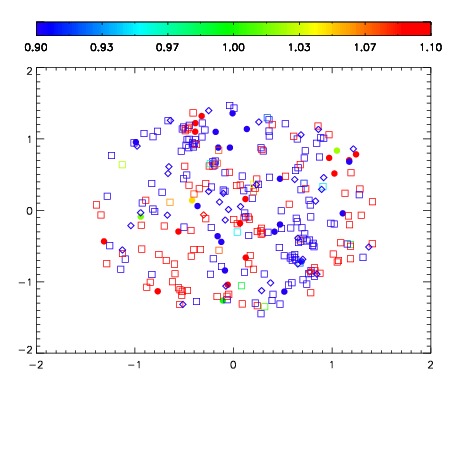
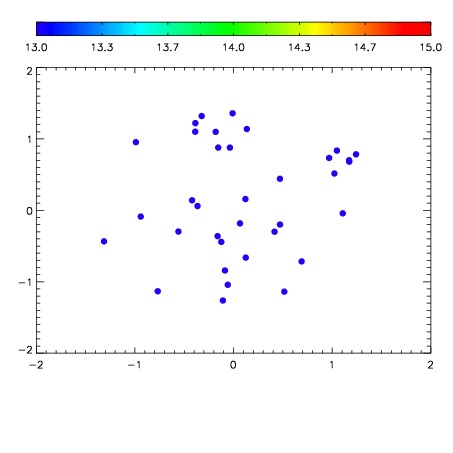

| Frame | Nreads | Zeropoints | Mag plots | Spatial mag deviation | Spatial sky 16325A emission deviations (filled: sky, open: star) | Spatial sky continuum emission | Spatial sky telluric CO2 absorption deviations (filled: H < 10) | |||||||||||||||||||||||
| 0 | 0 |
|
|
|
|
|
|
| IPAIR | NAME | SHIFT | NEWSHIFT | S/N | NAME | SHIFT | NEWSHIFT | S/N |
| 0 | 13820012 | 0.502065 | 0.00000 | 19.0976 | 13820015 | -0.000301389 | 0.502366 | 19.0846 |
| 1 | 13820016 | 0.501104 | 0.000961006 | 19.1974 | 13820014 | -7.50566e-05 | 0.502140 | 19.1105 |
| 2 | 13820013 | 0.501455 | 0.000609994 | 19.1082 | 13820011 | 0.00000 | 0.502065 | 19.0871 |
| 3 | 13820017 | 0.501729 | 0.000335991 | 19.0383 | 13820018 | -0.000772759 | 0.502838 | 19.0280 |