| Red | Green | Blue | |
| z | 17.64 | ||
| znorm | Inf | ||
| sky | -Inf | -Inf | -NaN |
| S/N | 28.2 | 47.2 | 51.8 |
| S/N(c) | 0.0 | 0.0 | 0.0 |
| SN(E/C) |

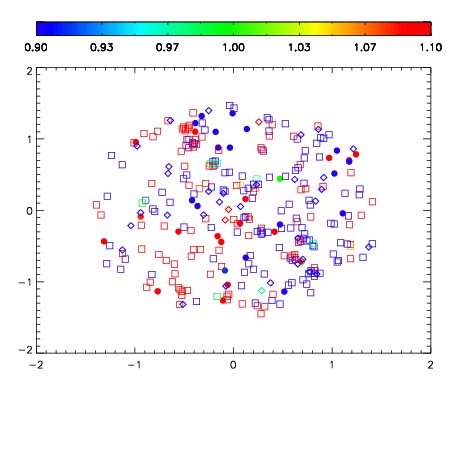


| Frame | Nreads | Zeropoints | Mag plots | Spatial mag deviation | Spatial sky 16325A emission deviations (filled: sky, open: star) | Spatial sky continuum emission | Spatial sky telluric CO2 absorption deviations (filled: H < 10) | |||||||||||||||||||||||
| 0 | 0 |
|
|
|
|
|
|
| IPAIR | NAME | SHIFT | NEWSHIFT | S/N | NAME | SHIFT | NEWSHIFT | S/N |
| 0 | 14300017 | 0.504023 | 0.00000 | 19.0434 | 14300014 | 0.000102548 | 0.503920 | 19.1301 |
| 1 | 14300016 | 0.503352 | 0.000671029 | 18.9994 | 14300018 | 0.00311046 | 0.500913 | 19.0842 |
| 2 | 14300013 | 0.503390 | 0.000633001 | 18.9963 | 14300015 | 0.000241555 | 0.503781 | 19.0251 |
| 3 | 14300012 | 0.502370 | 0.00165302 | 18.9429 | 14300011 | 0.00000 | 0.504023 | 18.9880 |