| Red | Green | Blue | |
| z | 17.64 | ||
| znorm | Inf | ||
| sky | -NaN | -Inf | -NaN |
| S/N | 27.2 | 48.1 | 52.5 |
| S/N(c) | 0.0 | 0.0 | 0.0 |
| SN(E/C) |
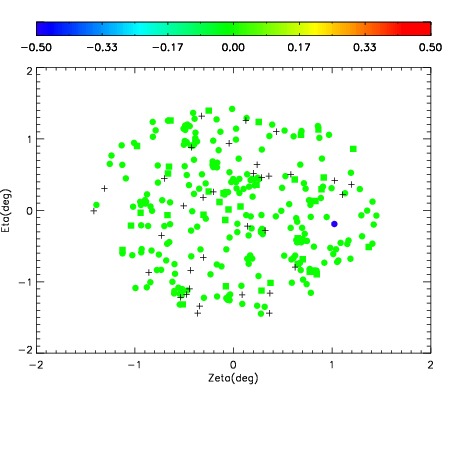

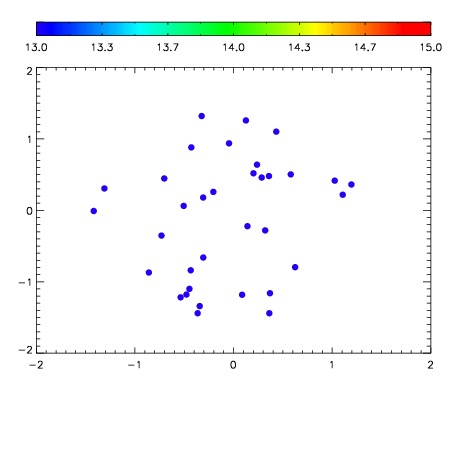

| Frame | Nreads | Zeropoints | Mag plots | Spatial mag deviation | Spatial sky 16325A emission deviations (filled: sky, open: star) | Spatial sky continuum emission | Spatial sky telluric CO2 absorption deviations (filled: H < 10) | |||||||||||||||||||||||
| 0 | 0 |
|
|
|
|
|
|
| IPAIR | NAME | SHIFT | NEWSHIFT | S/N | NAME | SHIFT | NEWSHIFT | S/N |
| 0 | 14310013 | 0.499601 | 0.00000 | 19.0447 | 14310015 | -0.00127104 | 0.500872 | 18.9973 |
| 1 | 14310012 | 0.498860 | 0.000741005 | 19.1307 | 14310014 | -0.00106252 | 0.500664 | 19.0251 |
| 2 | 14310016 | 0.498127 | 0.00147399 | 18.9860 | 14310011 | 0.00000 | 0.499601 | 18.9402 |
| 3 | 14310017 | 0.499077 | 0.000524014 | 18.8626 | 14310018 | 0.000447334 | 0.499154 | 18.8796 |