| Red | Green | Blue | |
| z | 17.64 | ||
| znorm | Inf | ||
| sky | -Inf | -Inf | -Inf |
| S/N | 28.8 | 49.1 | 53.3 |
| S/N(c) | 0.0 | 0.0 | 0.0 |
| SN(E/C) |
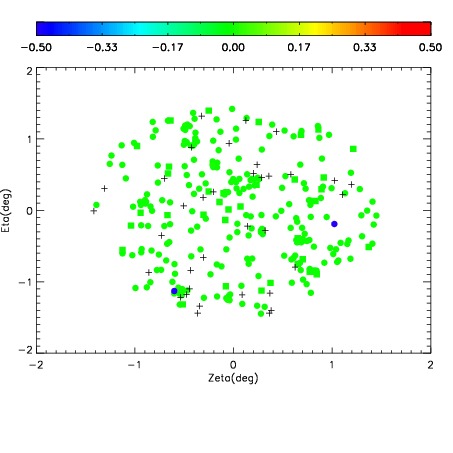
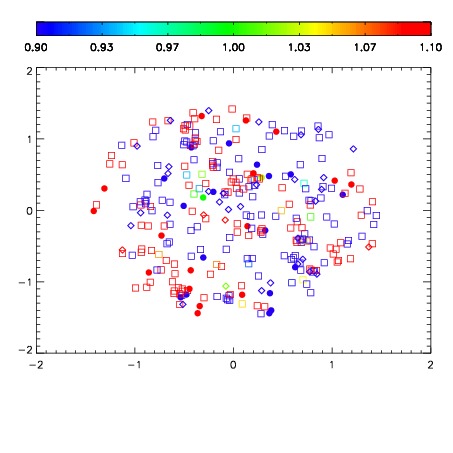
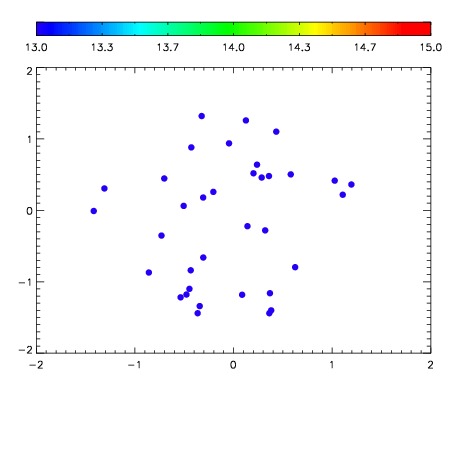

| Frame | Nreads | Zeropoints | Mag plots | Spatial mag deviation | Spatial sky 16325A emission deviations (filled: sky, open: star) | Spatial sky continuum emission | Spatial sky telluric CO2 absorption deviations (filled: H < 10) | |||||||||||||||||||||||
| 0 | 0 |
|
|
|
|
|
|
| IPAIR | NAME | SHIFT | NEWSHIFT | S/N | NAME | SHIFT | NEWSHIFT | S/N |
| 0 | 14370017 | 0.498565 | 0.00000 | 19.0769 | 14370014 | 0.00146998 | 0.497095 | 19.0969 |
| 1 | 14370013 | 0.497143 | 0.00142199 | 19.0522 | 14370018 | 0.00272799 | 0.495837 | 19.0571 |
| 2 | 14370012 | 0.496579 | 0.00198600 | 19.0171 | 14370015 | 0.00160285 | 0.496962 | 19.0376 |
| 3 | 14370016 | 0.497764 | 0.000800997 | 18.9966 | 14370011 | 0.00000 | 0.498565 | 18.9160 |