| Red | Green | Blue | |
| z | 17.64 | ||
| znorm | Inf | ||
| sky | -Inf | -Inf | -Inf |
| S/N | 28.5 | 47.0 | 51.7 |
| S/N(c) | 0.0 | 0.0 | 0.0 |
| SN(E/C) |
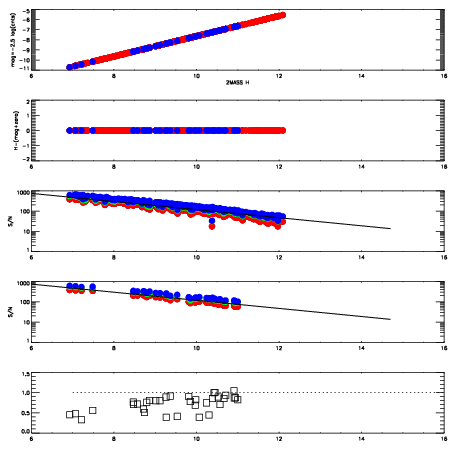
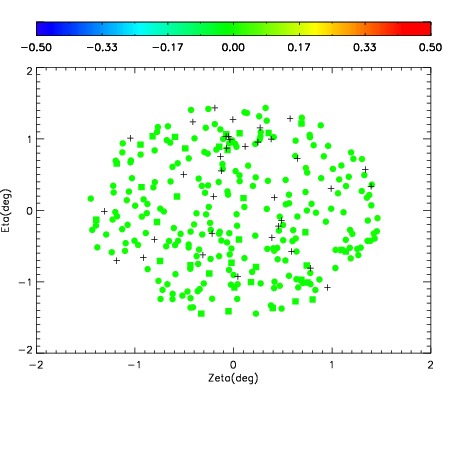
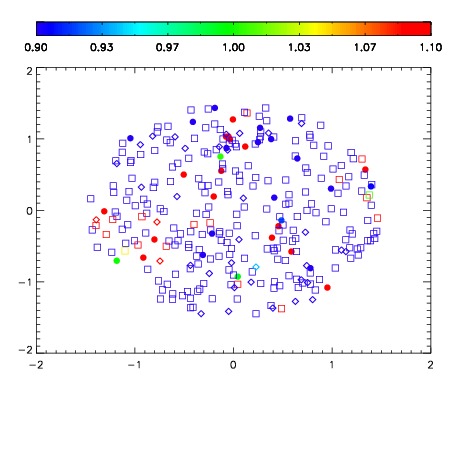
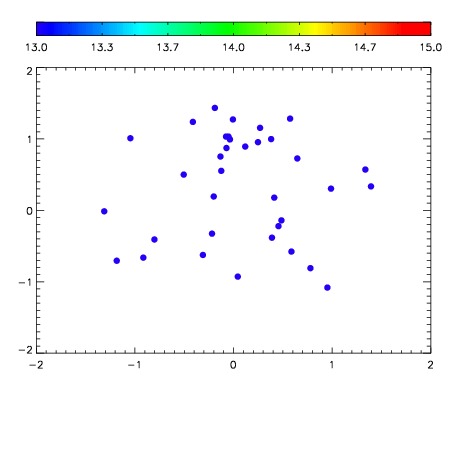

| Frame | Nreads | Zeropoints | Mag plots | Spatial mag deviation | Spatial sky 16325A emission deviations (filled: sky, open: star) | Spatial sky continuum emission | Spatial sky telluric CO2 absorption deviations (filled: H < 10) | |||||||||||||||||||||||
| 0 | 0 |
|
|
|
|
|
|
| IPAIR | NAME | SHIFT | NEWSHIFT | S/N | NAME | SHIFT | NEWSHIFT | S/N |
| 0 | 13710041 | 0.494513 | 0.00000 | 19.1537 | 13710040 | 0.00000 | 0.494513 | 19.1482 |
| 1 | 13710042 | 0.494318 | 0.000194997 | 19.1600 | 13710043 | 0.000503229 | 0.494010 | 19.1793 |
| 2 | 13710045 | 0.490399 | 0.00411400 | 19.1373 | 13710044 | -0.000366802 | 0.494880 | 19.1327 |
| 3 | 13710046 | 0.491647 | 0.00286600 | 19.0886 | 13710047 | -0.00158371 | 0.496097 | 19.0952 |