| Red | Green | Blue | |
| z | 17.64 | ||
| znorm | Inf | ||
| sky | -Inf | -Inf | -Inf |
| S/N | 25.7 | 43.8 | 46.9 |
| S/N(c) | 0.0 | 0.0 | 0.0 |
| SN(E/C) |
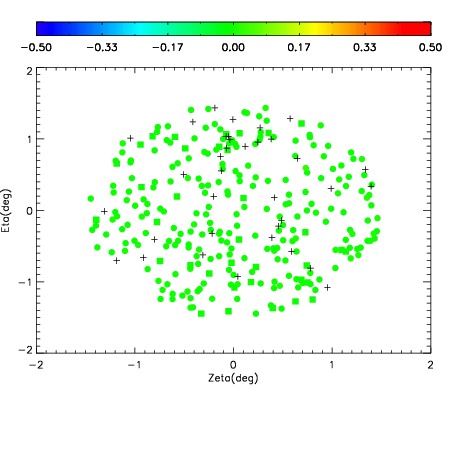
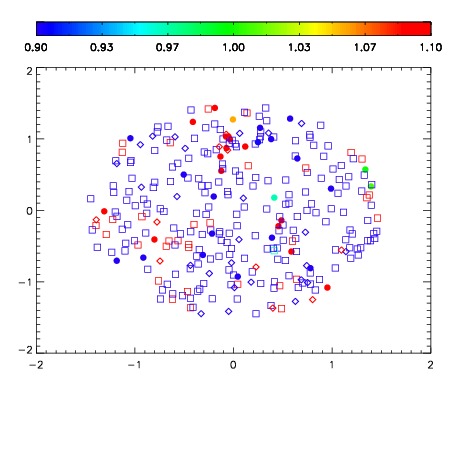
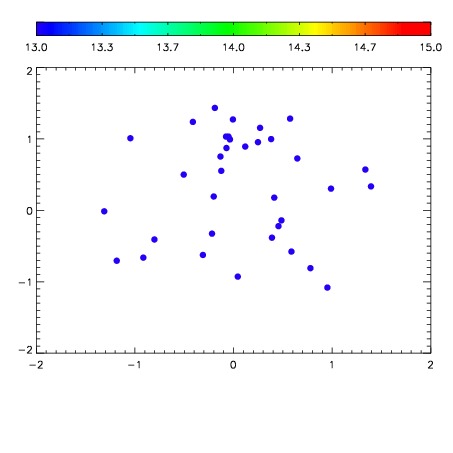

| Frame | Nreads | Zeropoints | Mag plots | Spatial mag deviation | Spatial sky 16325A emission deviations (filled: sky, open: star) | Spatial sky continuum emission | Spatial sky telluric CO2 absorption deviations (filled: H < 10) | |||||||||||||||||||||||
| 0 | 0 |
|
|
|
|
|
|
| IPAIR | NAME | SHIFT | NEWSHIFT | S/N | NAME | SHIFT | NEWSHIFT | S/N |
| 0 | 13740050 | 0.501859 | 0.00000 | 18.8989 | 13740055 | -0.00112163 | 0.502981 | 18.8909 |
| 1 | 13740053 | 0.499730 | 0.00212902 | 19.1269 | 13740048 | 0.00000 | 0.501859 | 19.1203 |
| 2 | 13740049 | 0.500072 | 0.00178701 | 19.0868 | 13740052 | -0.00160134 | 0.503460 | 19.0868 |
| 3 | 13740054 | 0.500653 | 0.00120598 | 18.9764 | 13740051 | -0.00129611 | 0.503155 | 19.0343 |