| Red | Green | Blue | |
| z | 17.64 | ||
| znorm | Inf | ||
| sky | -Inf | -Inf | -Inf |
| S/N | 24.6 | 42.0 | 45.3 |
| S/N(c) | 0.0 | 0.0 | 0.0 |
| SN(E/C) |
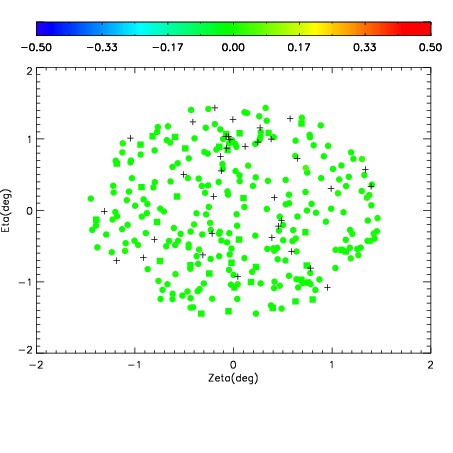
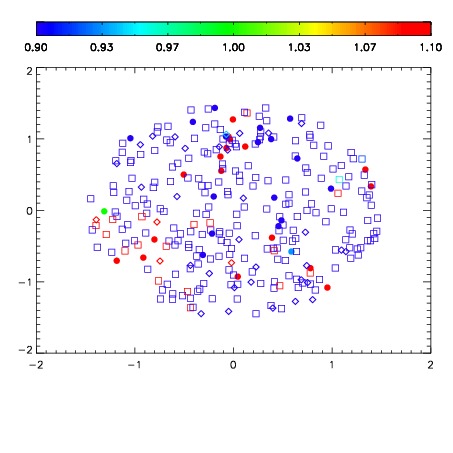
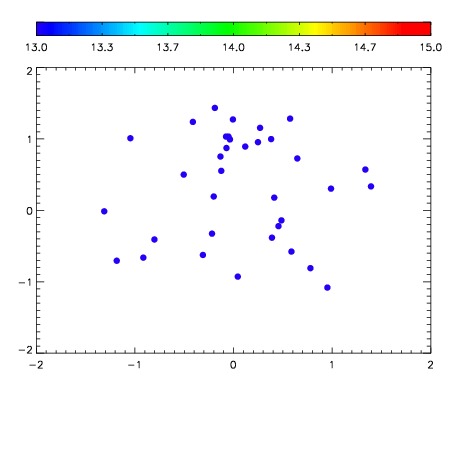

| Frame | Nreads | Zeropoints | Mag plots | Spatial mag deviation | Spatial sky 16325A emission deviations (filled: sky, open: star) | Spatial sky continuum emission | Spatial sky telluric CO2 absorption deviations (filled: H < 10) | |||||||||||||||||||||||
| 0 | 0 |
|
|
|
|
|
|
| IPAIR | NAME | SHIFT | NEWSHIFT | S/N | NAME | SHIFT | NEWSHIFT | S/N |
| 0 | 14090013 | 0.495821 | 0.00000 | 18.9324 | 14090015 | -0.000303401 | 0.496124 | 18.8252 |
| 1 | 14090012 | 0.494793 | 0.00102800 | 18.9833 | 14090011 | 0.00000 | 0.495821 | 19.0190 |
| 2 | 14090016 | 0.495042 | 0.000779003 | 18.9513 | 14090014 | -0.000221915 | 0.496043 | 18.9189 |
| 3 | 14090017 | 0.495499 | 0.000321984 | 18.8478 | 14090018 | 0.000170219 | 0.495651 | 18.6943 |