| Red | Green | Blue | |
| z | 17.64 | ||
| znorm | Inf | ||
| sky | -Inf | -Inf | -Inf |
| S/N | 30.9 | 52.4 | 56.7 |
| S/N(c) | 0.0 | 0.0 | 0.0 |
| SN(E/C) |
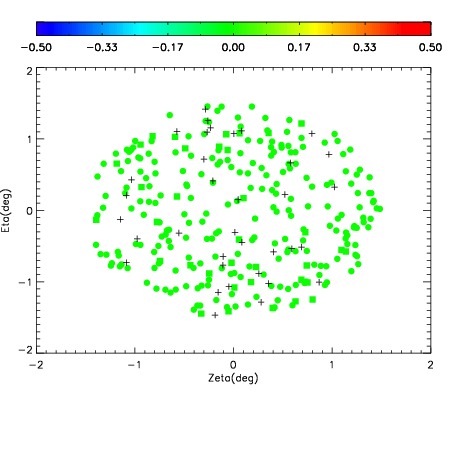
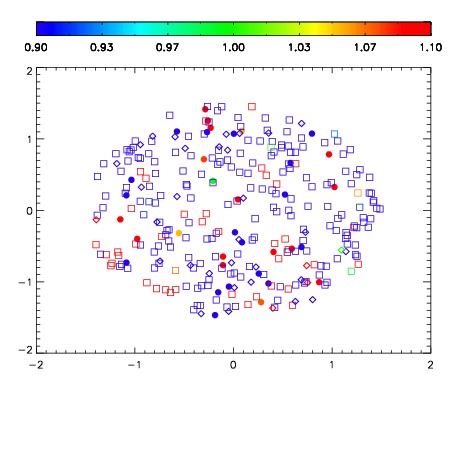
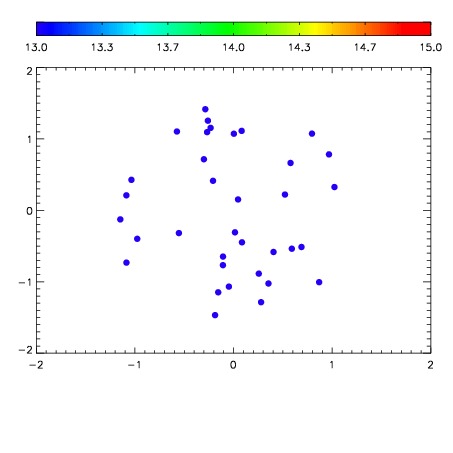

| Frame | Nreads | Zeropoints | Mag plots | Spatial mag deviation | Spatial sky 16325A emission deviations (filled: sky, open: star) | Spatial sky continuum emission | Spatial sky telluric CO2 absorption deviations (filled: H < 10) | |||||||||||||||||||||||
| 0 | 0 |
|
|
|
|
|
|
| IPAIR | NAME | SHIFT | NEWSHIFT | S/N | NAME | SHIFT | NEWSHIFT | S/N |
| 0 | 13720050 | 0.497381 | 0.00000 | 19.1228 | 13720048 | 0.00000 | 0.497381 | 19.1137 |
| 1 | 13720049 | 0.497192 | 0.000189006 | 19.0843 | 13720052 | -0.00214803 | 0.499529 | 19.1118 |
| 2 | 13720053 | 0.496764 | 0.000616997 | 19.0613 | 13720051 | -0.00101382 | 0.498395 | 19.1067 |
| 3 | 13720054 | 0.496612 | 0.000768989 | 19.0171 | 13720056 | -0.00265300 | 0.500034 | 19.0538 |
| 4 | 13720057 | 0.497209 | 0.000171989 | 18.9475 | 13720055 | -0.00188431 | 0.499265 | 18.9555 |