| Red | Green | Blue | |
| z | 17.64 | ||
| znorm | Inf | ||
| sky | -Inf | -Inf | -Inf |
| S/N | 27.4 | 47.1 | 52.3 |
| S/N(c) | 0.0 | 0.0 | 0.0 |
| SN(E/C) |
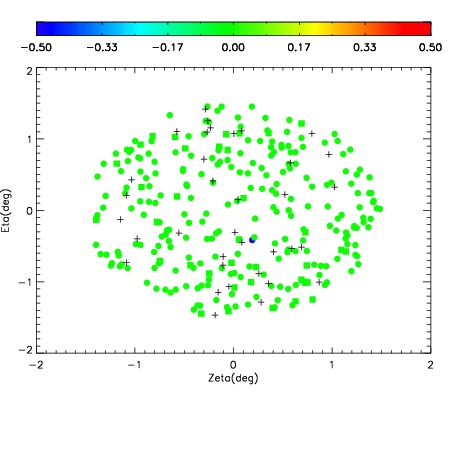
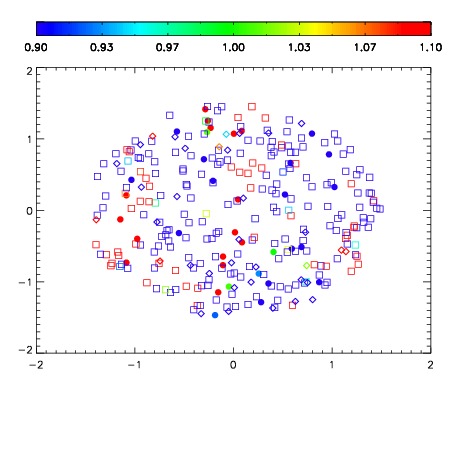


| Frame | Nreads | Zeropoints | Mag plots | Spatial mag deviation | Spatial sky 16325A emission deviations (filled: sky, open: star) | Spatial sky continuum emission | Spatial sky telluric CO2 absorption deviations (filled: H < 10) | |||||||||||||||||||||||
| 0 | 0 |
|
|
|
|
|
|
| IPAIR | NAME | SHIFT | NEWSHIFT | S/N | NAME | SHIFT | NEWSHIFT | S/N |
| 0 | 14290031 | 0.504586 | 0.00000 | 19.0510 | 14290033 | 0.000282370 | 0.504304 | 19.0283 |
| 1 | 14290027 | 0.503926 | 0.000660002 | 19.1227 | 14290029 | 0.000825524 | 0.503760 | 19.1075 |
| 2 | 14290028 | 0.504307 | 0.000279009 | 19.1194 | 14290030 | 0.00130850 | 0.503277 | 19.0816 |
| 3 | 14290032 | 0.503958 | 0.000627995 | 19.0879 | 14290026 | 0.00000 | 0.504586 | 19.0792 |