| Red | Green | Blue | |
| z | 17.64 | ||
| znorm | Inf | ||
| sky | -Inf | -Inf | -Inf |
| S/N | 19.3 | 34.5 | 37.1 |
| S/N(c) | 0.0 | 0.0 | 0.0 |
| SN(E/C) |
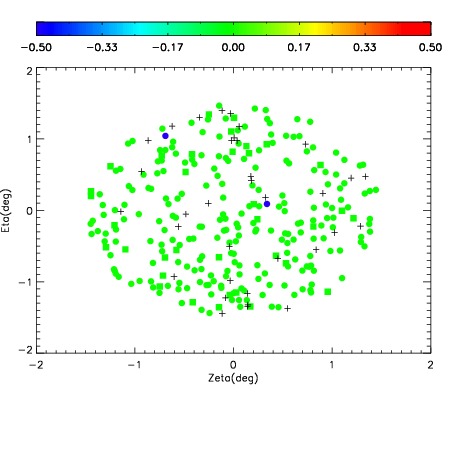
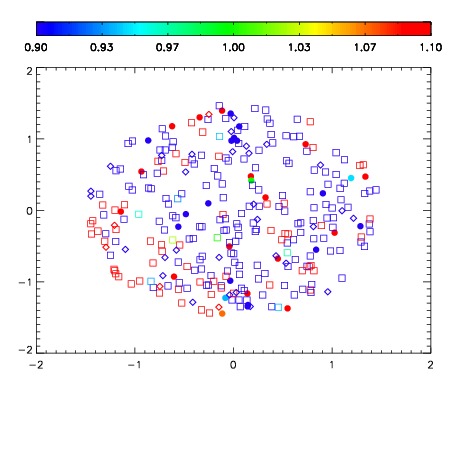


| Frame | Nreads | Zeropoints | Mag plots | Spatial mag deviation | Spatial sky 16325A emission deviations (filled: sky, open: star) | Spatial sky continuum emission | Spatial sky telluric CO2 absorption deviations (filled: H < 10) | |||||||||||||||||||||||
| 0 | 0 |
|
|
|
|
|
|
| IPAIR | NAME | SHIFT | NEWSHIFT | S/N | NAME | SHIFT | NEWSHIFT | S/N |
| 0 | 13700050 | 0.504891 | 0.00000 | 18.9163 | 13700051 | -0.00140201 | 0.506293 | 18.8015 |
| 1 | 13700049 | 0.504251 | 0.000639975 | 18.9835 | 13700048 | 0.00000 | 0.504891 | 18.9497 |
| 2 | 13700053 | 0.500242 | 0.00464898 | 18.6968 | 13700052 | -0.00203726 | 0.506928 | 18.6956 |