| Red | Green | Blue | |
| z | 17.64 | ||
| znorm | Inf | ||
| sky | -Inf | -Inf | -NaN |
| S/N | 24.8 | 44.3 | 48.1 |
| S/N(c) | 0.0 | 0.0 | 0.0 |
| SN(E/C) |
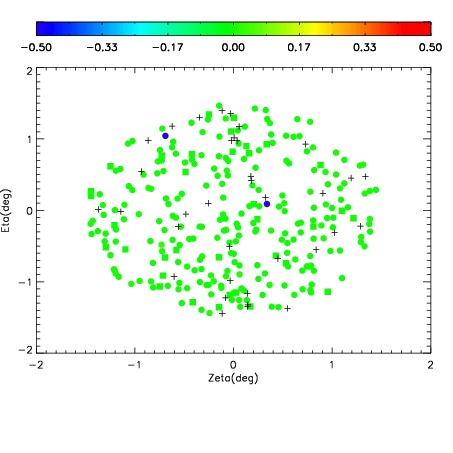
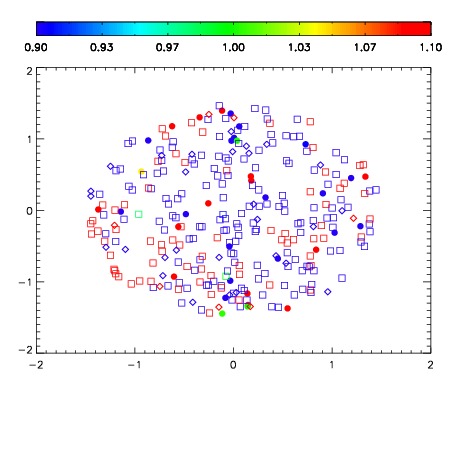
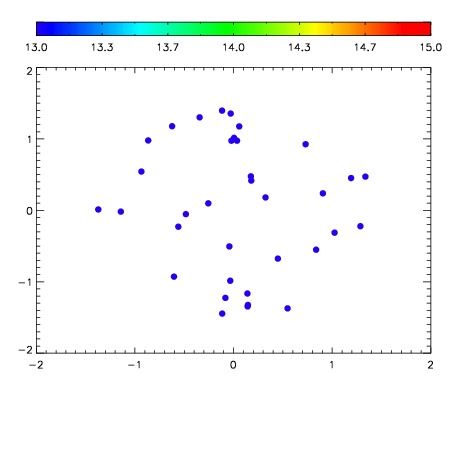

| Frame | Nreads | Zeropoints | Mag plots | Spatial mag deviation | Spatial sky 16325A emission deviations (filled: sky, open: star) | Spatial sky continuum emission | Spatial sky telluric CO2 absorption deviations (filled: H < 10) | |||||||||||||||||||||||
| 0 | 0 |
|
|
|
|
|
|
| IPAIR | NAME | SHIFT | NEWSHIFT | S/N | NAME | SHIFT | NEWSHIFT | S/N |
| 0 | 13730049 | 0.500969 | 0.00000 | 19.0524 | 13730047 | 0.00000 | 0.500969 | 19.1050 |
| 1 | 13730048 | 0.500637 | 0.000331998 | 19.0469 | 13730050 | -0.000799564 | 0.501769 | 18.9252 |
| 2 | 13730053 | 0.500577 | 0.000392020 | 18.9104 | 13730051 | -0.00140936 | 0.502378 | 18.8720 |
| 3 | 13730052 | 0.499834 | 0.00113499 | 18.8840 | 13730054 | -0.00219336 | 0.503162 | 18.8604 |