| Red | Green | Blue | |
| z | 17.64 | ||
| znorm | Inf | ||
| sky | -NaN | -NaN | -Inf |
| S/N | 28.2 | 49.2 | 53.3 |
| S/N(c) | 0.0 | 0.0 | 0.0 |
| SN(E/C) |
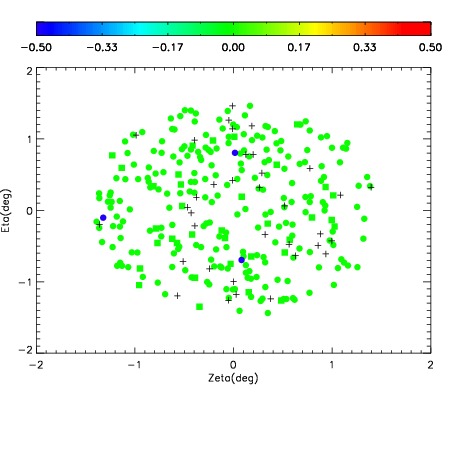
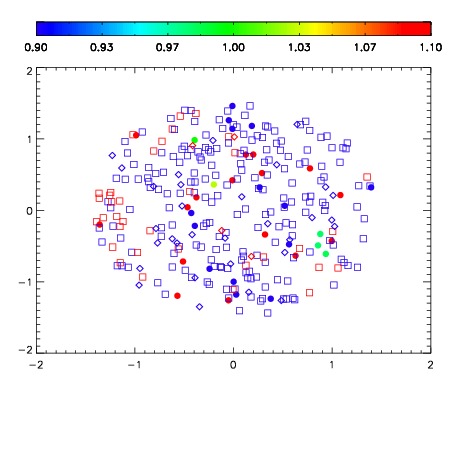
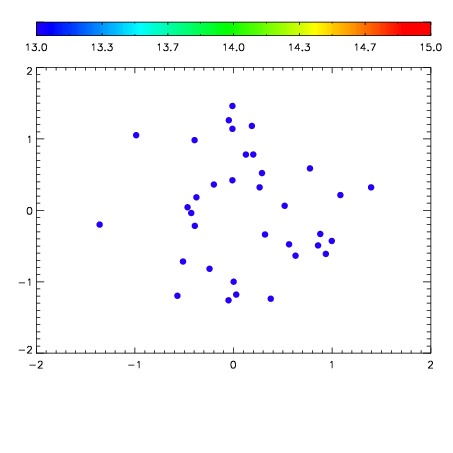

| Frame | Nreads | Zeropoints | Mag plots | Spatial mag deviation | Spatial sky 16325A emission deviations (filled: sky, open: star) | Spatial sky continuum emission | Spatial sky telluric CO2 absorption deviations (filled: H < 10) | |||||||||||||||||||||||
| 0 | 0 |
|
|
|
|
|
|
| IPAIR | NAME | SHIFT | NEWSHIFT | S/N | NAME | SHIFT | NEWSHIFT | S/N |
| 0 | 13820024 | 0.497164 | 0.00000 | 19.2236 | 13820025 | -0.00147739 | 0.498641 | 19.1972 |
| 1 | 13820028 | 0.496919 | 0.000245005 | 19.2073 | 13820022 | 0.00000 | 0.497164 | 19.1809 |
| 2 | 13820027 | 0.496409 | 0.000755012 | 19.1910 | 13820029 | -0.000423424 | 0.497587 | 19.1601 |
| 3 | 13820023 | 0.497117 | 4.69983e-05 | 19.1305 | 13820026 | -0.00105119 | 0.498215 | 19.1145 |