| Red | Green | Blue | |
| z | 17.64 | ||
| znorm | Inf | ||
| sky | -Inf | -Inf | -NaN |
| S/N | 26.0 | 46.5 | 48.5 |
| S/N(c) | 0.0 | 0.0 | 0.0 |
| SN(E/C) |
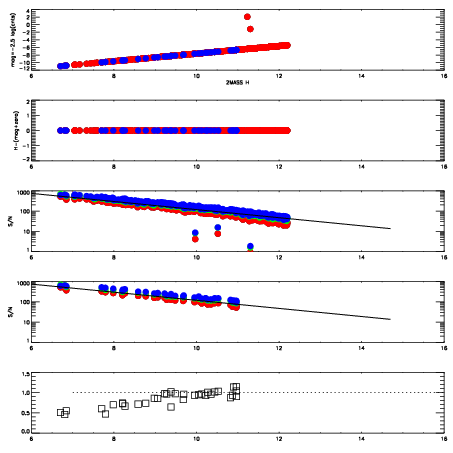
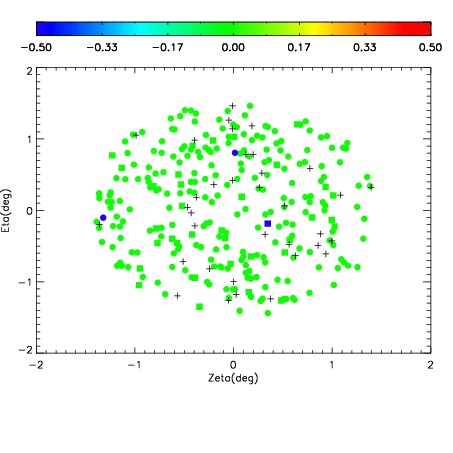
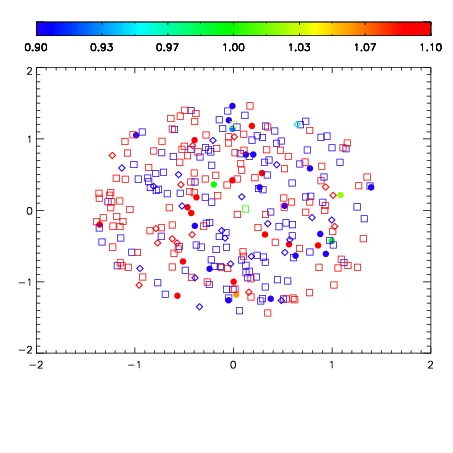


| Frame | Nreads | Zeropoints | Mag plots | Spatial mag deviation | Spatial sky 16325A emission deviations (filled: sky, open: star) | Spatial sky continuum emission | Spatial sky telluric CO2 absorption deviations (filled: H < 10) | |||||||||||||||||||||||
| 0 | 0 |
|
|
|
|
|
|
| IPAIR | NAME | SHIFT | NEWSHIFT | S/N | NAME | SHIFT | NEWSHIFT | S/N |
| 0 | 14330020 | 0.500228 | 0.00000 | 19.0641 | 14330018 | 0.00000 | 0.500228 | 19.1023 |
| 1 | 14330023 | 0.499772 | 0.000455976 | 19.1653 | 14330022 | -0.000220507 | 0.500448 | 19.1914 |
| 2 | 14330019 | 0.500010 | 0.000217974 | 19.1486 | 14330021 | 6.53871e-05 | 0.500163 | 19.1376 |
| 3 | 14330024 | 0.499966 | 0.000261992 | 19.1338 | 14330025 | -0.000374750 | 0.500603 | 19.1109 |