| Red | Green | Blue | |
| z | 17.64 | ||
| znorm | Inf | ||
| sky | -NaN | -Inf | -Inf |
| S/N | 23.5 | 42.3 | 44.8 |
| S/N(c) | 0.0 | 0.0 | 0.0 |
| SN(E/C) |
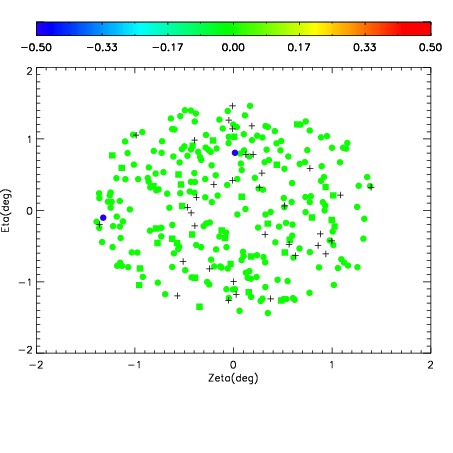
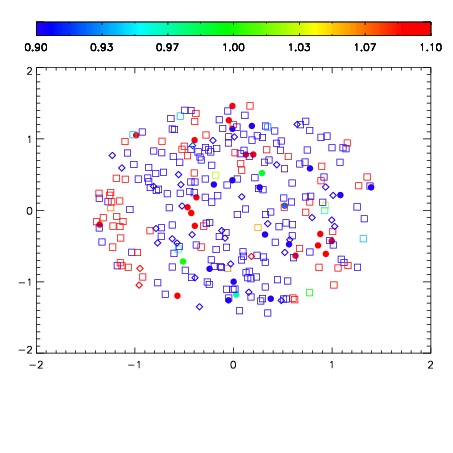


| Frame | Nreads | Zeropoints | Mag plots | Spatial mag deviation | Spatial sky 16325A emission deviations (filled: sky, open: star) | Spatial sky continuum emission | Spatial sky telluric CO2 absorption deviations (filled: H < 10) | |||||||||||||||||||||||
| 0 | 0 |
|
|
|
|
|
|
| IPAIR | NAME | SHIFT | NEWSHIFT | S/N | NAME | SHIFT | NEWSHIFT | S/N |
| 0 | 14590017 | 0.502345 | 0.00000 | 19.0028 | 14590015 | 0.00137550 | 0.500970 | 18.9877 |
| 1 | 14590016 | 0.499805 | 0.00254002 | 19.0093 | 14590018 | 0.00437419 | 0.497971 | 19.0281 |
| 2 | 14590012 | 0.500046 | 0.00229901 | 18.9099 | 14590014 | 0.00143353 | 0.500911 | 18.9556 |
| 3 | 14590013 | 0.500835 | 0.00151002 | 18.9003 | 14590011 | 0.00000 | 0.502345 | 18.9271 |