| Red | Green | Blue | |
| z | 17.64 | ||
| znorm | Inf | ||
| sky | -Inf | -Inf | -Inf |
| S/N | 34.2 | 50.8 | 55.3 |
| S/N(c) | 0.0 | 0.0 | 0.0 |
| SN(E/C) |
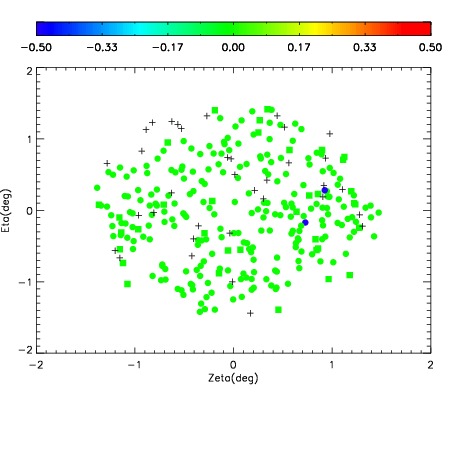
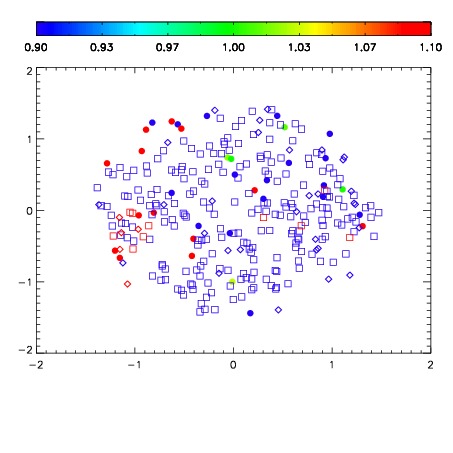


| Frame | Nreads | Zeropoints | Mag plots | Spatial mag deviation | Spatial sky 16325A emission deviations (filled: sky, open: star) | Spatial sky continuum emission | Spatial sky telluric CO2 absorption deviations (filled: H < 10) | |||||||||||||||||||||||
| 0 | 0 |
|
|
|
|
|
|
| IPAIR | NAME | SHIFT | NEWSHIFT | S/N | NAME | SHIFT | NEWSHIFT | S/N |
| 0 | 12860024 | 0.438874 | 0.00000 | 19.0943 | 12860023 | 0.00000 | 0.438874 | 19.0576 |
| 1 | 12860025 | 0.436617 | 0.00225702 | 19.0556 | 12860030 | -0.00583183 | 0.444706 | 19.0482 |
| 2 | 12860029 | 0.434807 | 0.00406700 | 19.0546 | 12860027 | -0.00282358 | 0.441698 | 19.0003 |
| 3 | 12860028 | 0.433298 | 0.00557601 | 19.0347 | 12860026 | -0.00234413 | 0.441218 | 18.9944 |