| Red | Green | Blue | |
| z | 17.64 | ||
| znorm | Inf | ||
| sky | -NaN | -Inf | -Inf |
| S/N | 33.2 | 51.2 | 56.6 |
| S/N(c) | 0.0 | 0.0 | 0.0 |
| SN(E/C) |
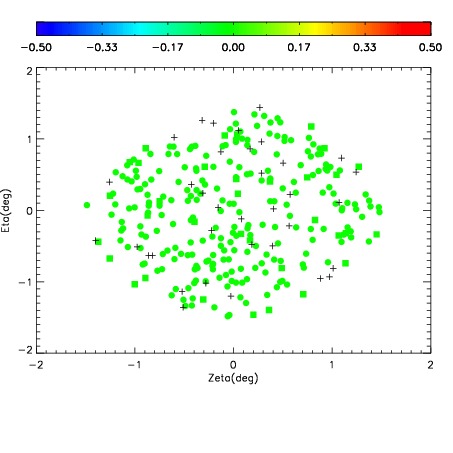
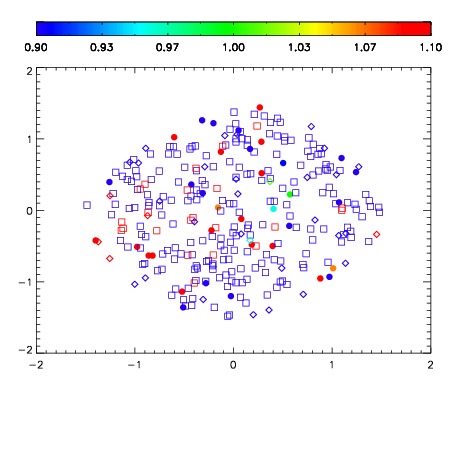
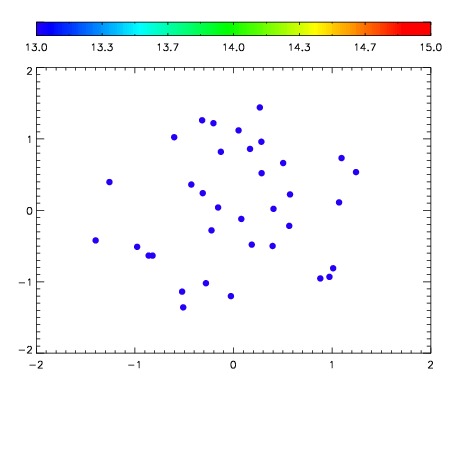

| Frame | Nreads | Zeropoints | Mag plots | Spatial mag deviation | Spatial sky 16325A emission deviations (filled: sky, open: star) | Spatial sky continuum emission | Spatial sky telluric CO2 absorption deviations (filled: H < 10) | |||||||||||||||||||||||
| 0 | 0 |
|
|
|
|
|
|
| IPAIR | NAME | SHIFT | NEWSHIFT | S/N | NAME | SHIFT | NEWSHIFT | S/N |
| 0 | 12880044 | 0.471751 | 0.00000 | 18.9757 | 12880038 | 0.00000 | 0.471751 | 18.5575 |
| 1 | 12880039 | 0.469693 | 0.00205800 | 19.1104 | 12880041 | -0.00387074 | 0.475622 | 19.1156 |
| 2 | 12880040 | 0.470949 | 0.000802010 | 19.0908 | 12880042 | -0.00280065 | 0.474552 | 19.0833 |
| 3 | 12880043 | 0.471203 | 0.000548005 | 19.0441 | 12880045 | -0.00488064 | 0.476632 | 19.0339 |