| Red | Green | Blue | |
| z | 17.64 | ||
| znorm | Inf | ||
| sky | -Inf | -Inf | -NaN |
| S/N | 33.8 | 50.9 | 55.5 |
| S/N(c) | 0.0 | 0.0 | 0.0 |
| SN(E/C) |
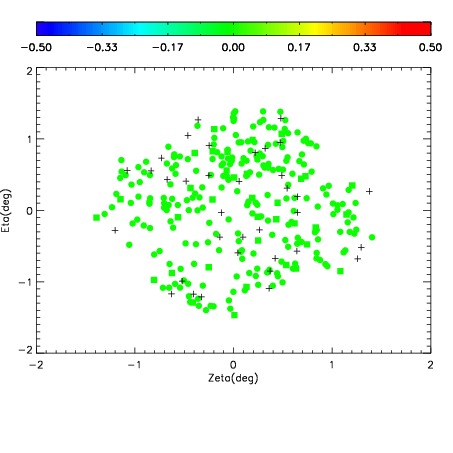
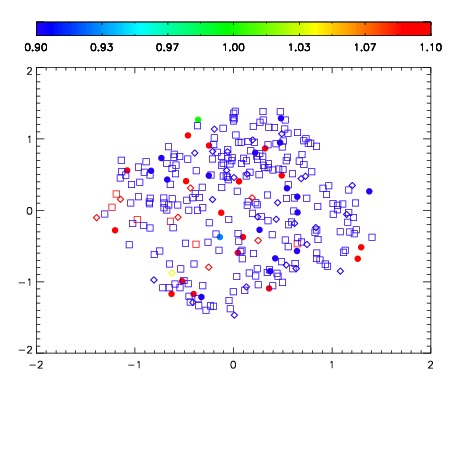


| Frame | Nreads | Zeropoints | Mag plots | Spatial mag deviation | Spatial sky 16325A emission deviations (filled: sky, open: star) | Spatial sky continuum emission | Spatial sky telluric CO2 absorption deviations (filled: H < 10) | |||||||||||||||||||||||
| 0 | 0 |
|
|
|
|
|
|
| IPAIR | NAME | SHIFT | NEWSHIFT | S/N | NAME | SHIFT | NEWSHIFT | S/N |
| 0 | 12860013 | 0.469712 | 0.00000 | 18.6682 | 12860012 | 0.00000 | 0.469712 | 18.4354 |
| 1 | 12860018 | 0.465314 | 0.00439799 | 19.0961 | 12860016 | -0.00933446 | 0.479046 | 19.1182 |
| 2 | 12860017 | 0.465132 | 0.00457999 | 19.0913 | 12860015 | -0.00751512 | 0.477227 | 19.1115 |
| 3 | 12860014 | 0.468915 | 0.000797004 | 19.0753 | 12860019 | -0.0128364 | 0.482548 | 19.0929 |