| Red | Green | Blue | |
| z | 17.64 | ||
| znorm | Inf | ||
| sky | -Inf | -Inf | -NaN |
| S/N | 35.1 | 52.5 | 58.6 |
| S/N(c) | 0.0 | 0.0 | 0.0 |
| SN(E/C) |

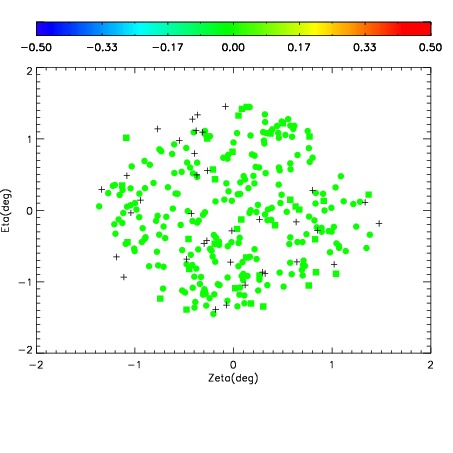
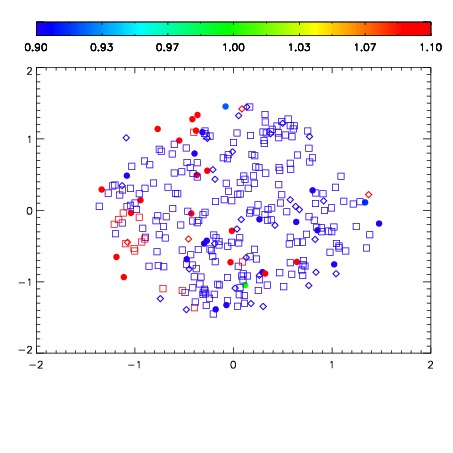
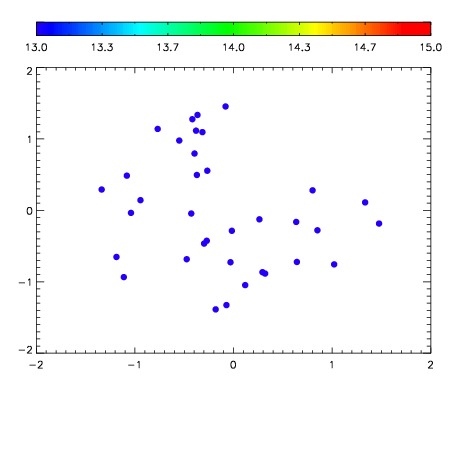

| Frame | Nreads | Zeropoints | Mag plots | Spatial mag deviation | Spatial sky 16325A emission deviations (filled: sky, open: star) | Spatial sky continuum emission | Spatial sky telluric CO2 absorption deviations (filled: H < 10) | |||||||||||||||||||||||
| 0 | 0 |
|
|
|
|
|
|
| IPAIR | NAME | SHIFT | NEWSHIFT | S/N | NAME | SHIFT | NEWSHIFT | S/N |
| 0 | 12880033 | 0.455100 | 0.00000 | 19.1544 | 12880030 | -0.00588020 | 0.460980 | 19.1391 |
| 1 | 12880028 | 0.451816 | 0.00328401 | 19.1293 | 12880031 | -0.00674041 | 0.461840 | 19.1295 |
| 2 | 12880032 | 0.450720 | 0.00437999 | 19.1251 | 12880034 | -0.00471856 | 0.459819 | 19.1258 |
| 3 | 12880029 | 0.454252 | 0.000847995 | 19.1082 | 12880027 | 0.00000 | 0.455100 | 19.0956 |