| Red | Green | Blue | |
| z | 17.64 | ||
| znorm | Inf | ||
| sky | -Inf | -Inf | -Inf |
| S/N | 25.4 | 44.2 | 48.5 |
| S/N(c) | 0.0 | 0.0 | 0.0 |
| SN(E/C) |
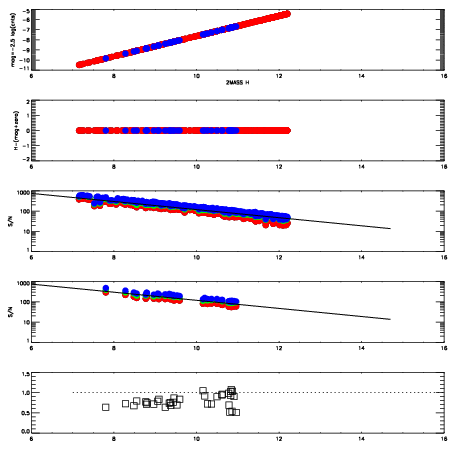
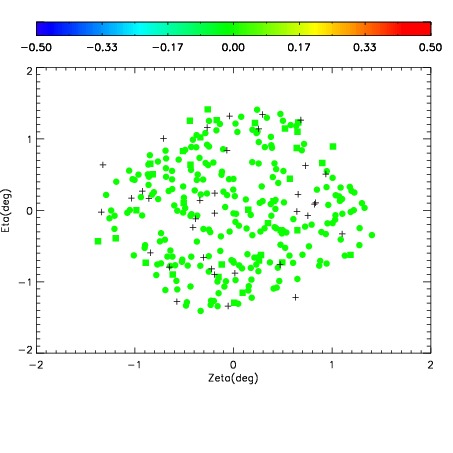


| Frame | Nreads | Zeropoints | Mag plots | Spatial mag deviation | Spatial sky 16325A emission deviations (filled: sky, open: star) | Spatial sky continuum emission | Spatial sky telluric CO2 absorption deviations (filled: H < 10) | |||||||||||||||||||||||
| 0 | 0 |
|
|
|
|
|
|
| IPAIR | NAME | SHIFT | NEWSHIFT | S/N | NAME | SHIFT | NEWSHIFT | S/N |
| 0 | 12880050 | 0.472145 | 0.00000 | 19.1142 | 12880049 | 0.00000 | 0.472145 | 19.1127 |
| 1 | 12880051 | 0.471764 | 0.000380993 | 19.1206 | 12880052 | -0.00228086 | 0.474426 | 19.1206 |
| 2 | 12880055 | 0.471552 | 0.000592977 | 19.0727 | 12880053 | -0.00216788 | 0.474313 | 19.0684 |
| 3 | 12880054 | 0.471412 | 0.000732988 | 19.0531 | 12880056 | -0.00153459 | 0.473680 | 19.0507 |