| Red | Green | Blue | |
| z | 17.64 | ||
| znorm | Inf | ||
| sky | -Inf | -NaN | -Inf |
| S/N | 27.2 | 42.3 | 48.5 |
| S/N(c) | 0.0 | 0.0 | 0.0 |
| SN(E/C) |
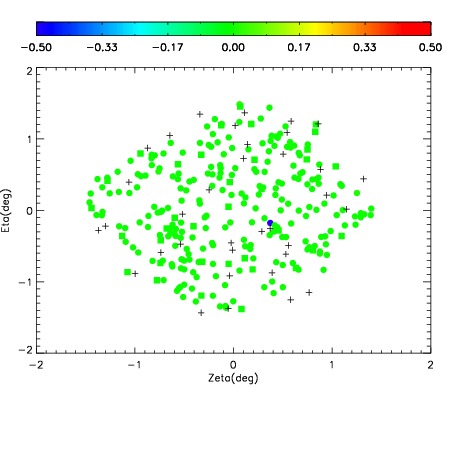
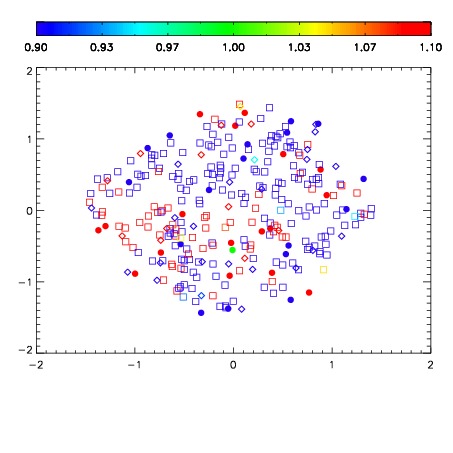
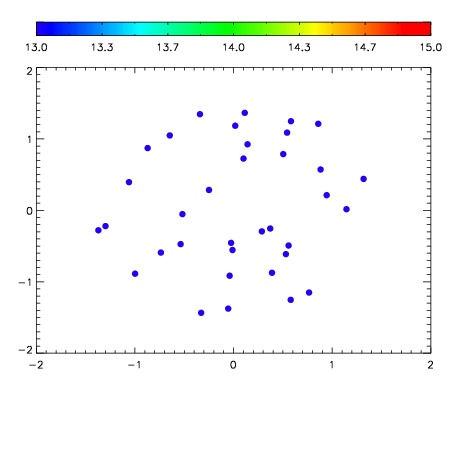

| Frame | Nreads | Zeropoints | Mag plots | Spatial mag deviation | Spatial sky 16325A emission deviations (filled: sky, open: star) | Spatial sky continuum emission | Spatial sky telluric CO2 absorption deviations (filled: H < 10) | |||||||||||||||||||||||
| 0 | 0 |
|
|
|
|
|
|
| IPAIR | NAME | SHIFT | NEWSHIFT | S/N | NAME | SHIFT | NEWSHIFT | S/N |
| 0 | 13760028 | 0.505858 | 0.00000 | 18.2573 | 13760029 | 0.000479635 | 0.505378 | 17.6312 |
| 1 | 13760023 | 0.504478 | 0.00138003 | 18.8935 | 13760025 | -0.00137481 | 0.507233 | 19.0248 |
| 2 | 13760024 | 0.504898 | 0.000959992 | 18.8367 | 13760026 | -0.00140608 | 0.507264 | 18.9650 |
| 3 | 13760027 | 0.505043 | 0.000814974 | 18.6152 | 13760022 | 0.00000 | 0.505858 | 18.8732 |