| Red | Green | Blue | |
| z | 17.64 | ||
| znorm | Inf | ||
| sky | -Inf | -Inf | -Inf |
| S/N | 21.5 | 38.2 | 44.1 |
| S/N(c) | 0.0 | 0.0 | 0.0 |
| SN(E/C) |
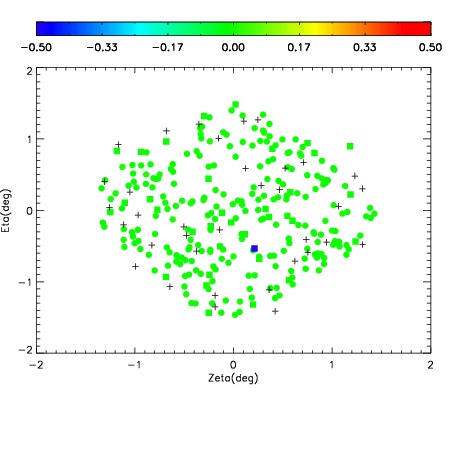
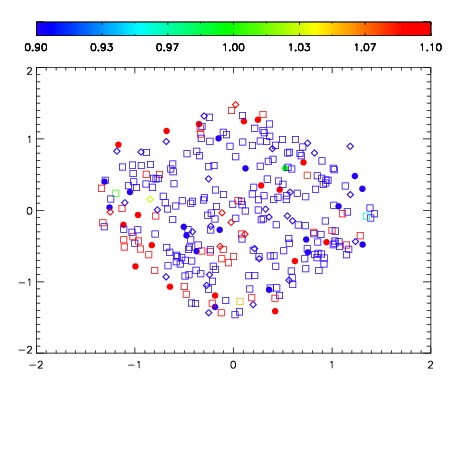


| Frame | Nreads | Zeropoints | Mag plots | Spatial mag deviation | Spatial sky 16325A emission deviations (filled: sky, open: star) | Spatial sky continuum emission | Spatial sky telluric CO2 absorption deviations (filled: H < 10) | |||||||||||||||||||||||
| 0 | 0 |
|
|
|
|
|
|
| IPAIR | NAME | SHIFT | NEWSHIFT | S/N | NAME | SHIFT | NEWSHIFT | S/N |
| 0 | 13750030 | 0.504736 | 0.00000 | 18.3888 | 13750028 | 0.000992699 | 0.503743 | 18.7116 |
| 1 | 13750025 | 0.501789 | 0.00294703 | 19.0734 | 13750024 | 0.00000 | 0.504736 | 19.1191 |
| 2 | 13750026 | 0.503003 | 0.00173301 | 18.9584 | 13750027 | 0.000764101 | 0.503972 | 18.9066 |
| 3 | 13750029 | 0.503560 | 0.00117600 | 18.8151 | 13750031 | 0.00169071 | 0.503045 | 18.8914 |