| Red | Green | Blue | |
| z | 17.64 | ||
| znorm | Inf | ||
| sky | -Inf | -Inf | -NaN |
| S/N | 23.4 | 36.1 | 40.2 |
| S/N(c) | 0.0 | 0.0 | 0.0 |
| SN(E/C) |
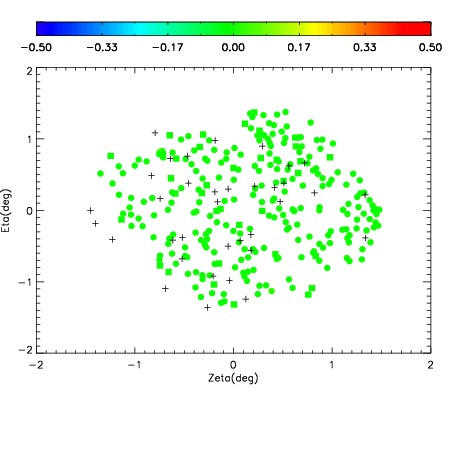

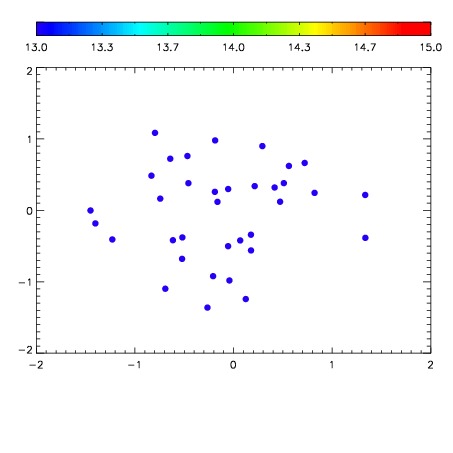

| Frame | Nreads | Zeropoints | Mag plots | Spatial mag deviation | Spatial sky 16325A emission deviations (filled: sky, open: star) | Spatial sky continuum emission | Spatial sky telluric CO2 absorption deviations (filled: H < 10) | |||||||||||||||||||||||
| 0 | 0 |
|
|
|
|
|
|
| IPAIR | NAME | SHIFT | NEWSHIFT | S/N | NAME | SHIFT | NEWSHIFT | S/N |
| 0 | 12870016 | 0.468711 | 0.00000 | 18.0323 | 12870015 | 0.00000 | 0.468711 | 18.4449 |
| 1 | 12870020 | 0.458844 | 0.00986698 | 19.0078 | 12870022 | -0.00710676 | 0.475818 | 18.9624 |
| 2 | 12870021 | 0.460579 | 0.00813198 | 18.9944 | 12870019 | -0.00388083 | 0.472592 | 18.9236 |
| 3 | 12870017 | 0.467996 | 0.000714988 | 18.0429 | 12870018 | -0.00413647 | 0.472847 | 18.5795 |