| Red | Green | Blue | |
| z | 17.64 | ||
| znorm | Inf | ||
| sky | -Inf | -Inf | -Inf |
| S/N | 31.5 | 55.2 | 60.2 |
| S/N(c) | 0.0 | 0.0 | 0.0 |
| SN(E/C) |

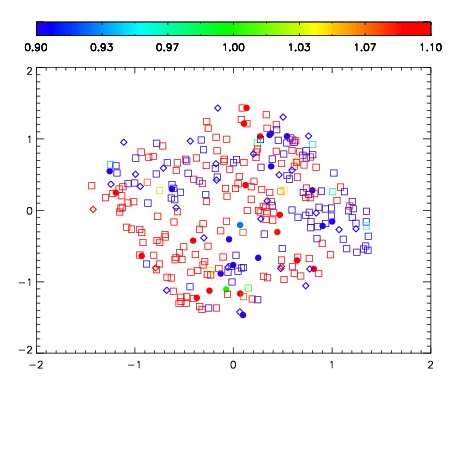


| Frame | Nreads | Zeropoints | Mag plots | Spatial mag deviation | Spatial sky 16325A emission deviations (filled: sky, open: star) | Spatial sky continuum emission | Spatial sky telluric CO2 absorption deviations (filled: H < 10) | |||||||||||||||||||||||
| 0 | 0 |
|
|
|
|
|
|
| IPAIR | NAME | SHIFT | NEWSHIFT | S/N | NAME | SHIFT | NEWSHIFT | S/N |
| 0 | 13690039 | 0.504651 | 0.00000 | 19.2386 | 13690040 | -0.000794505 | 0.505446 | 19.2542 |
| 1 | 13690042 | 0.501226 | 0.00342500 | 19.1994 | 13690041 | -0.00139938 | 0.506050 | 19.2542 |
| 2 | 13690038 | 0.504322 | 0.000329018 | 19.1933 | 13690044 | -0.00166796 | 0.506319 | 19.1576 |
| 3 | 13690043 | 0.502022 | 0.00262898 | 19.1439 | 13690037 | 0.00000 | 0.504651 | 19.1515 |