| Red | Green | Blue | |
| z | 17.64 | ||
| znorm | Inf | ||
| sky | -Inf | -Inf | -Inf |
| S/N | 22.3 | 41.1 | 47.5 |
| S/N(c) | 0.0 | 0.0 | 0.0 |
| SN(E/C) |
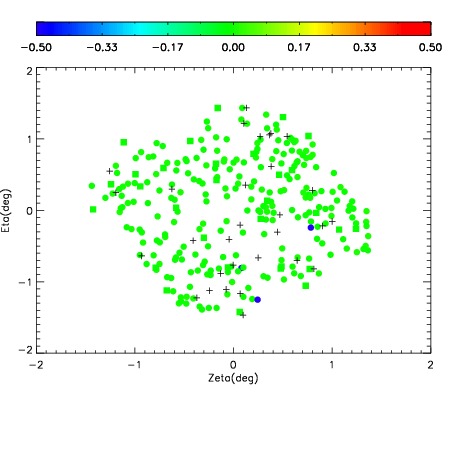
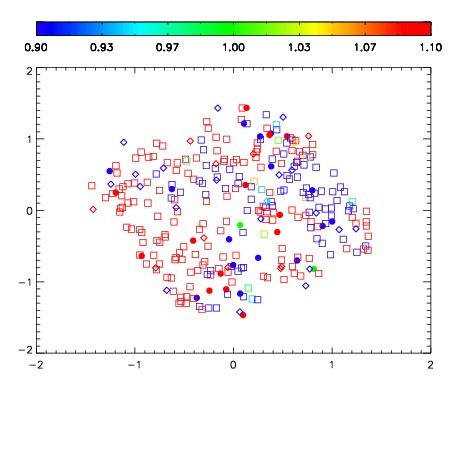


| Frame | Nreads | Zeropoints | Mag plots | Spatial mag deviation | Spatial sky 16325A emission deviations (filled: sky, open: star) | Spatial sky continuum emission | Spatial sky telluric CO2 absorption deviations (filled: H < 10) | |||||||||||||||||||||||
| 0 | 0 |
|
|
|
|
|
|
| IPAIR | NAME | SHIFT | NEWSHIFT | S/N | NAME | SHIFT | NEWSHIFT | S/N |
| 0 | 17020045 | 0.485827 | 0.00000 | 18.6441 | 17020047 | 0.000967995 | 0.484859 | 18.6524 |
| 1 | 17020049 | 0.482986 | 0.00284100 | 18.9687 | 17020050 | -0.00467866 | 0.490506 | 19.0744 |
| 2 | 17020048 | 0.483284 | 0.00254300 | 18.7640 | 17020046 | 0.00210563 | 0.483721 | 18.7061 |
| 3 | 17020044 | 0.485696 | 0.000131011 | 18.6886 | 17020043 | 0.00000 | 0.485827 | 18.7046 |