| Red | Green | Blue | |
| z | 17.64 | ||
| znorm | Inf | ||
| sky | -Inf | -NaN | -Inf |
| S/N | 31.3 | 53.9 | 63.1 |
| S/N(c) | 0.0 | 0.0 | 0.0 |
| SN(E/C) |
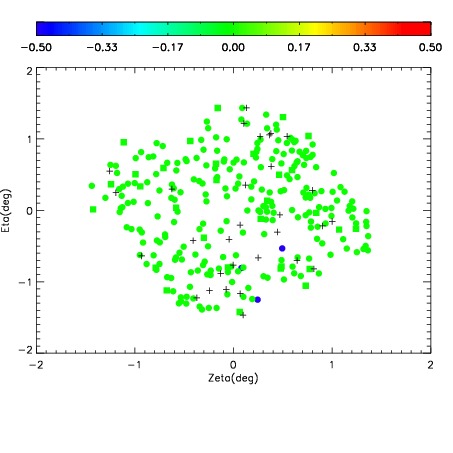

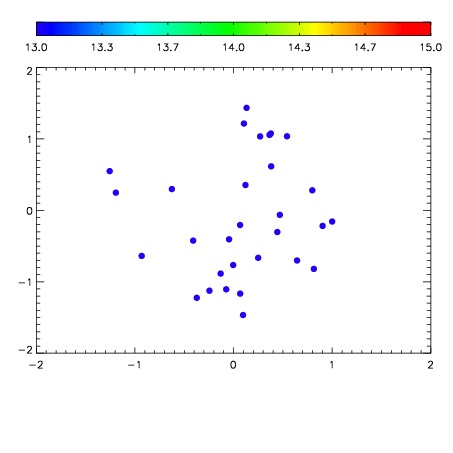

| Frame | Nreads | Zeropoints | Mag plots | Spatial mag deviation | Spatial sky 16325A emission deviations (filled: sky, open: star) | Spatial sky continuum emission | Spatial sky telluric CO2 absorption deviations (filled: H < 10) | |||||||||||||||||||||||
| 0 | 0 |
|
|
|
|
|
|
| IPAIR | NAME | SHIFT | NEWSHIFT | S/N | NAME | SHIFT | NEWSHIFT | S/N |
| 0 | 17310038 | 0.506550 | 0.00000 | 19.1708 | 17310039 | 0.000207136 | 0.506343 | 19.1928 |
| 1 | 17310033 | 0.506019 | 0.000531018 | 19.2503 | 17310032 | 0.00000 | 0.506550 | 19.2389 |
| 2 | 17310034 | 0.506338 | 0.000212014 | 19.2435 | 17310035 | 0.00101986 | 0.505530 | 19.2294 |
| 3 | 17310037 | 0.505729 | 0.000820994 | 19.2197 | 17310036 | 0.00105858 | 0.505491 | 19.2184 |