| Red | Green | Blue | |
| z | 17.64 | ||
| znorm | Inf | ||
| sky | -Inf | -Inf | -Inf |
| S/N | 35.2 | 53.1 | 58.4 |
| S/N(c) | 0.0 | 0.0 | 0.0 |
| SN(E/C) |
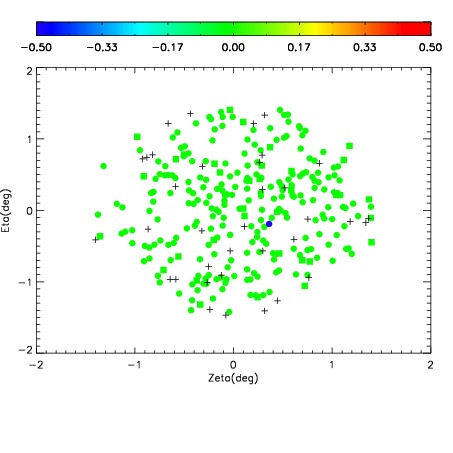
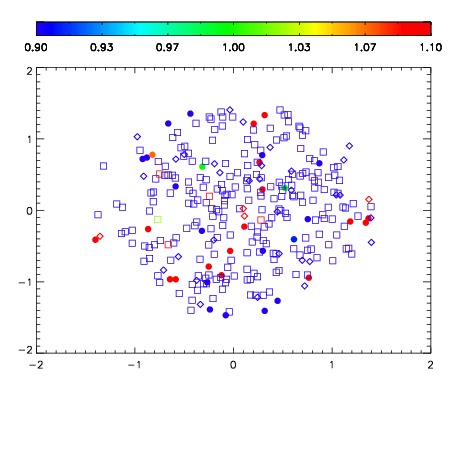
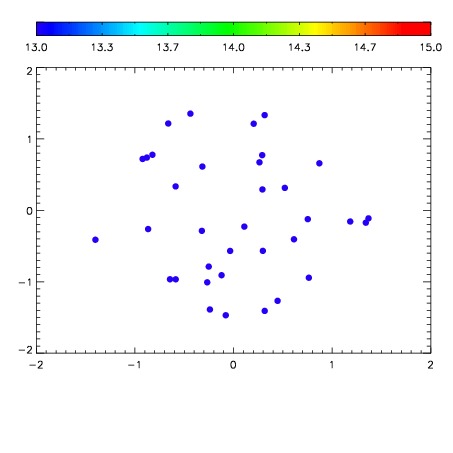

| Frame | Nreads | Zeropoints | Mag plots | Spatial mag deviation | Spatial sky 16325A emission deviations (filled: sky, open: star) | Spatial sky continuum emission | Spatial sky telluric CO2 absorption deviations (filled: H < 10) | |||||||||||||||||||||||
| 0 | 0 |
|
|
|
|
|
|
| IPAIR | NAME | SHIFT | NEWSHIFT | S/N | NAME | SHIFT | NEWSHIFT | S/N |
| 0 | 13710019 | 0.500077 | 0.00000 | 19.1523 | 13710020 | 0.00102816 | 0.499049 | 19.2214 |
| 1 | 13710018 | 0.499735 | 0.000342011 | 19.1306 | 13710017 | 3.04149e-05 | 0.500047 | 19.1558 |
| 2 | 13710014 | 0.497518 | 0.00255901 | 19.0957 | 13710013 | 0.00000 | 0.500077 | 19.1118 |
| 3 | 13710015 | 0.499584 | 0.000493020 | 19.0905 | 13710016 | 0.000499600 | 0.499577 | 19.0521 |