| Red | Green | Blue | |
| z | 17.64 | ||
| znorm | Inf | ||
| sky | -Inf | -Inf | -NaN |
| S/N | 26.7 | 47.4 | 53.6 |
| S/N(c) | 0.0 | 0.0 | 0.0 |
| SN(E/C) |
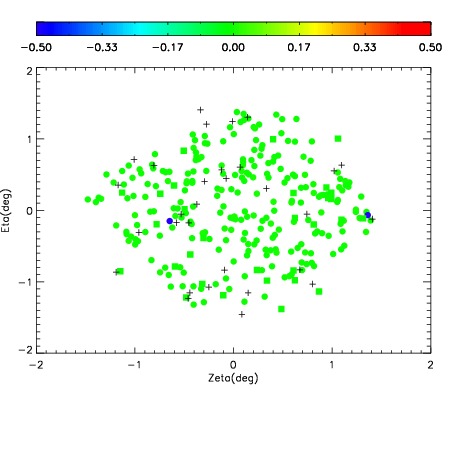
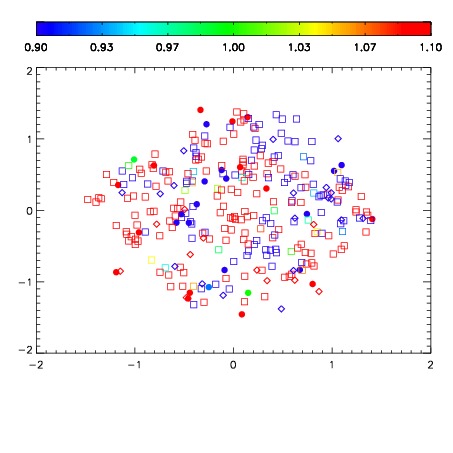


| Frame | Nreads | Zeropoints | Mag plots | Spatial mag deviation | Spatial sky 16325A emission deviations (filled: sky, open: star) | Spatial sky continuum emission | Spatial sky telluric CO2 absorption deviations (filled: H < 10) | |||||||||||||||||||||||
| 0 | 0 |
|
|
|
|
|
|
| IPAIR | NAME | SHIFT | NEWSHIFT | S/N | NAME | SHIFT | NEWSHIFT | S/N |
| 0 | 13700042 | 0.504478 | 0.00000 | 19.0931 | 13700040 | -0.000515673 | 0.504994 | 19.0525 |
| 1 | 13700038 | 0.503786 | 0.000691950 | 19.1554 | 13700037 | 0.00000 | 0.504478 | 19.1780 |
| 2 | 13700039 | 0.504473 | 5.00679e-06 | 19.1348 | 13700041 | -0.000346940 | 0.504825 | 19.0774 |
| 3 | 13700043 | 0.504470 | 7.98702e-06 | 19.0259 | 13700044 | -0.000405794 | 0.504884 | 18.9285 |