| Red | Green | Blue | |
| z | 17.64 | ||
| znorm | Inf | ||
| sky | -Inf | -Inf | -Inf |
| S/N | 31.9 | 52.9 | 67.2 |
| S/N(c) | 0.0 | 0.0 | 0.0 |
| SN(E/C) |
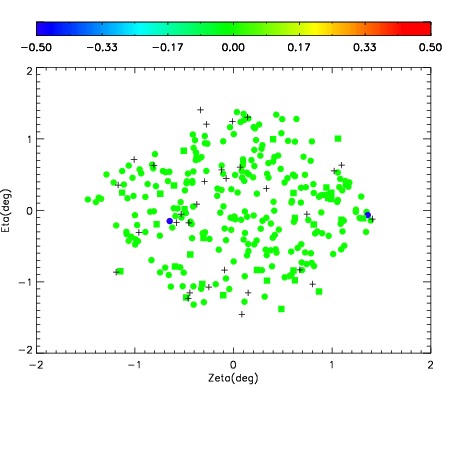
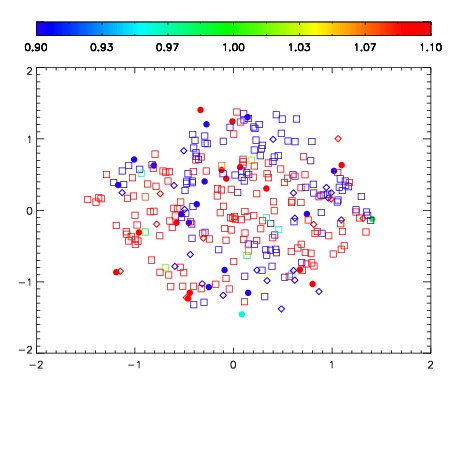


| Frame | Nreads | Zeropoints | Mag plots | Spatial mag deviation | Spatial sky 16325A emission deviations (filled: sky, open: star) | Spatial sky continuum emission | Spatial sky telluric CO2 absorption deviations (filled: H < 10) | |||||||||||||||||||||||
| 0 | 0 |
|
|
|
|
|
|
| IPAIR | NAME | SHIFT | NEWSHIFT | S/N | NAME | SHIFT | NEWSHIFT | S/N |
| 0 | 17030045 | 0.484498 | 0.00000 | 18.8806 | 17030047 | 0.000304389 | 0.484194 | 19.0122 |
| 1 | 17030054 | 0.481530 | 0.00296798 | 19.1618 | 17030052 | -0.00154660 | 0.486045 | 19.1702 |
| 2 | 17030050 | 0.483982 | 0.000515997 | 19.1578 | 17030055 | -0.00257879 | 0.487077 | 19.1587 |
| 3 | 17030053 | 0.481990 | 0.00250798 | 19.1496 | 17030051 | -0.00139400 | 0.485892 | 19.1393 |
| 4 | 17030049 | 0.483503 | 0.000994980 | 19.1315 | 17030048 | -0.000531657 | 0.485030 | 19.0873 |
| 5 | 17030046 | 0.484325 | 0.000173002 | 18.8396 | 17030044 | 0.00000 | 0.484498 | 18.9493 |