| Red | Green | Blue | |
| z | 17.64 | ||
| znorm | Inf | ||
| sky | -Inf | -Inf | -NaN |
| S/N | 27.9 | 48.4 | 59.9 |
| S/N(c) | 0.0 | 0.0 | 0.0 |
| SN(E/C) |
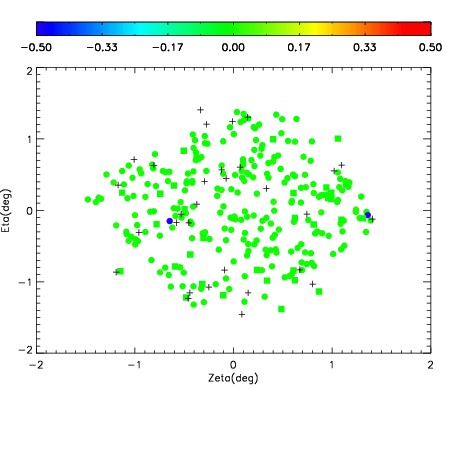

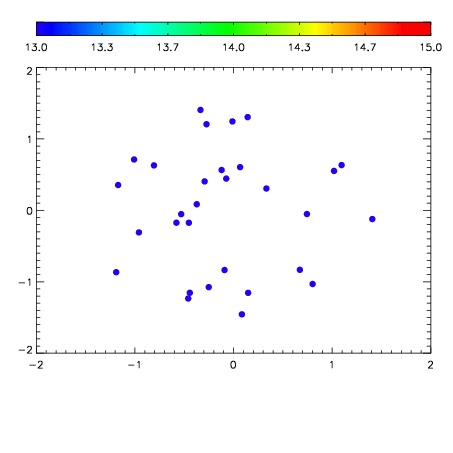

| Frame | Nreads | Zeropoints | Mag plots | Spatial mag deviation | Spatial sky 16325A emission deviations (filled: sky, open: star) | Spatial sky continuum emission | Spatial sky telluric CO2 absorption deviations (filled: H < 10) | |||||||||||||||||||||||
| 0 | 0 |
|
|
|
|
|
|
| IPAIR | NAME | SHIFT | NEWSHIFT | S/N | NAME | SHIFT | NEWSHIFT | S/N |
| 0 | 17040041 | 0.485838 | 0.00000 | 19.0240 | 17040044 | -0.00308594 | 0.488924 | 19.0315 |
| 1 | 17040045 | 0.483318 | 0.00251999 | 18.9967 | 17040036 | 0.00000 | 0.485838 | 19.0153 |
| 2 | 17040037 | 0.485460 | 0.000377983 | 18.9363 | 17040043 | -0.00262614 | 0.488464 | 19.0008 |
| 3 | 17040046 | 0.483371 | 0.00246701 | 18.9322 | 17040047 | -0.00402243 | 0.489860 | 18.8137 |
| 4 | 17040038 | 0.485472 | 0.000366002 | 18.9217 | 17040039 | 0.000935972 | 0.484902 | 18.5418 |
| 5 | 17040042 | 0.485696 | 0.000142008 | 18.8472 | 17040040 | 0.000982033 | 0.484856 | 18.3956 |